
Evaluating Models#
FiftyOne provides a variety of builtin methods for evaluating your model predictions, including regressions, classifications, detections, polygons, instance and semantic segmentations, on both image and video datasets.
When you evaluate a model in FiftyOne, you get access to the standard aggregate metrics such as classification reports, confusion matrices, and PR curves for your model. In addition, FiftyOne can also record fine-grained statistics like accuracy and false positive counts at the sample-level, which you can interactively explore in the App to diagnose the strengths and weaknesses of your models on individual data samples.
Sample-level analysis often leads to critical insights that will help you improve your datasets and models. For example, viewing the samples with the most false positive predictions can reveal errors in your annotation schema. Or, viewing the cluster of samples with the lowest accuracy can reveal gaps in your training dataset that you need to address in order to improve your model’s performance. A key goal of FiftyOne is to help you uncover these insights on your data!
Note
Check out the tutorials page for in-depth walkthroughs of evaluating various types of models with FiftyOne, or the Model Evaluation Guide for a complete step-by-step walkthrough.
Overview#
FiftyOne’s evaluation methods are conveniently exposed as methods on all
Dataset and DatasetView objects, which means that you can evaluate entire
datasets or specific views into them via the same syntax.
Let’s illustrate the basic workflow by loading the
quickstart dataset and analyzing the object
detections in its predictions field using the
evaluate_detections()
method:
 1import fiftyone as fo
 2import fiftyone.zoo as foz
 3
 4dataset = foz.load_zoo_dataset("quickstart")
 5
 6# Evaluate the objects in the `predictions` field with respect to the
 7# objects in the `ground_truth` field
 8results = dataset.evaluate_detections(
 9    "predictions",
10    gt_field="ground_truth",
11    eval_key="eval",
12)
13
14session = fo.launch_app(dataset)
Per-class metrics#
You can also retrieve and interact with evaluation results via the SDK.
Running an evaluation returns an instance of a task-specific subclass of
EvaluationResults that provides a handful of methods for generating aggregate
statistics about your dataset.
1# Get the 10 most common classes in the dataset
2counts = dataset.count_values("ground_truth.detections.label")
3classes = sorted(counts, key=counts.get, reverse=True)[:10]
4
5# Print a classification report for the top-10 classes
6results.print_report(classes=classes)
               precision    recall  f1-score   support

       person       0.45      0.74      0.56       783
         kite       0.55      0.72      0.62       156
          car       0.12      0.54      0.20        61
         bird       0.63      0.67      0.65       126
       carrot       0.06      0.49      0.11        47
         boat       0.05      0.24      0.08        37
    surfboard       0.10      0.43      0.17        30
traffic light       0.22      0.54      0.31        24
     airplane       0.29      0.67      0.40        24
      giraffe       0.26      0.65      0.37        23

    micro avg       0.32      0.68      0.44      1311
    macro avg       0.27      0.57      0.35      1311
 weighted avg       0.42      0.68      0.51      1311
Note
For details on micro, macro, and weighted averaging, see the sklearn.metrics documentation.
Per-sample metrics#
In addition to standard aggregate metrics, when you pass an eval_key
parameter to the evaluation routine, FiftyOne will populate helpful
task-specific information about your model’s predictions on each sample, such
as false negative/positive counts and per-sample accuracies.
Continuing with our example, let’s use dataset views and the FiftyOne App to leverage these sample metrics to investigate the samples with the most false positive predictions in the dataset:
 1import fiftyone as fo
 2from fiftyone import ViewField as F
 3
 4# Create a view that has samples with the most false positives first, and
 5# only includes false positive boxes in the `predictions` field
 6view = (
 7    dataset
 8    .sort_by("eval_fp", reverse=True)
 9    .filter_labels("predictions", F("eval") == "fp")
10)
11
12# Visualize results in the App
13session = fo.launch_app(view=view)
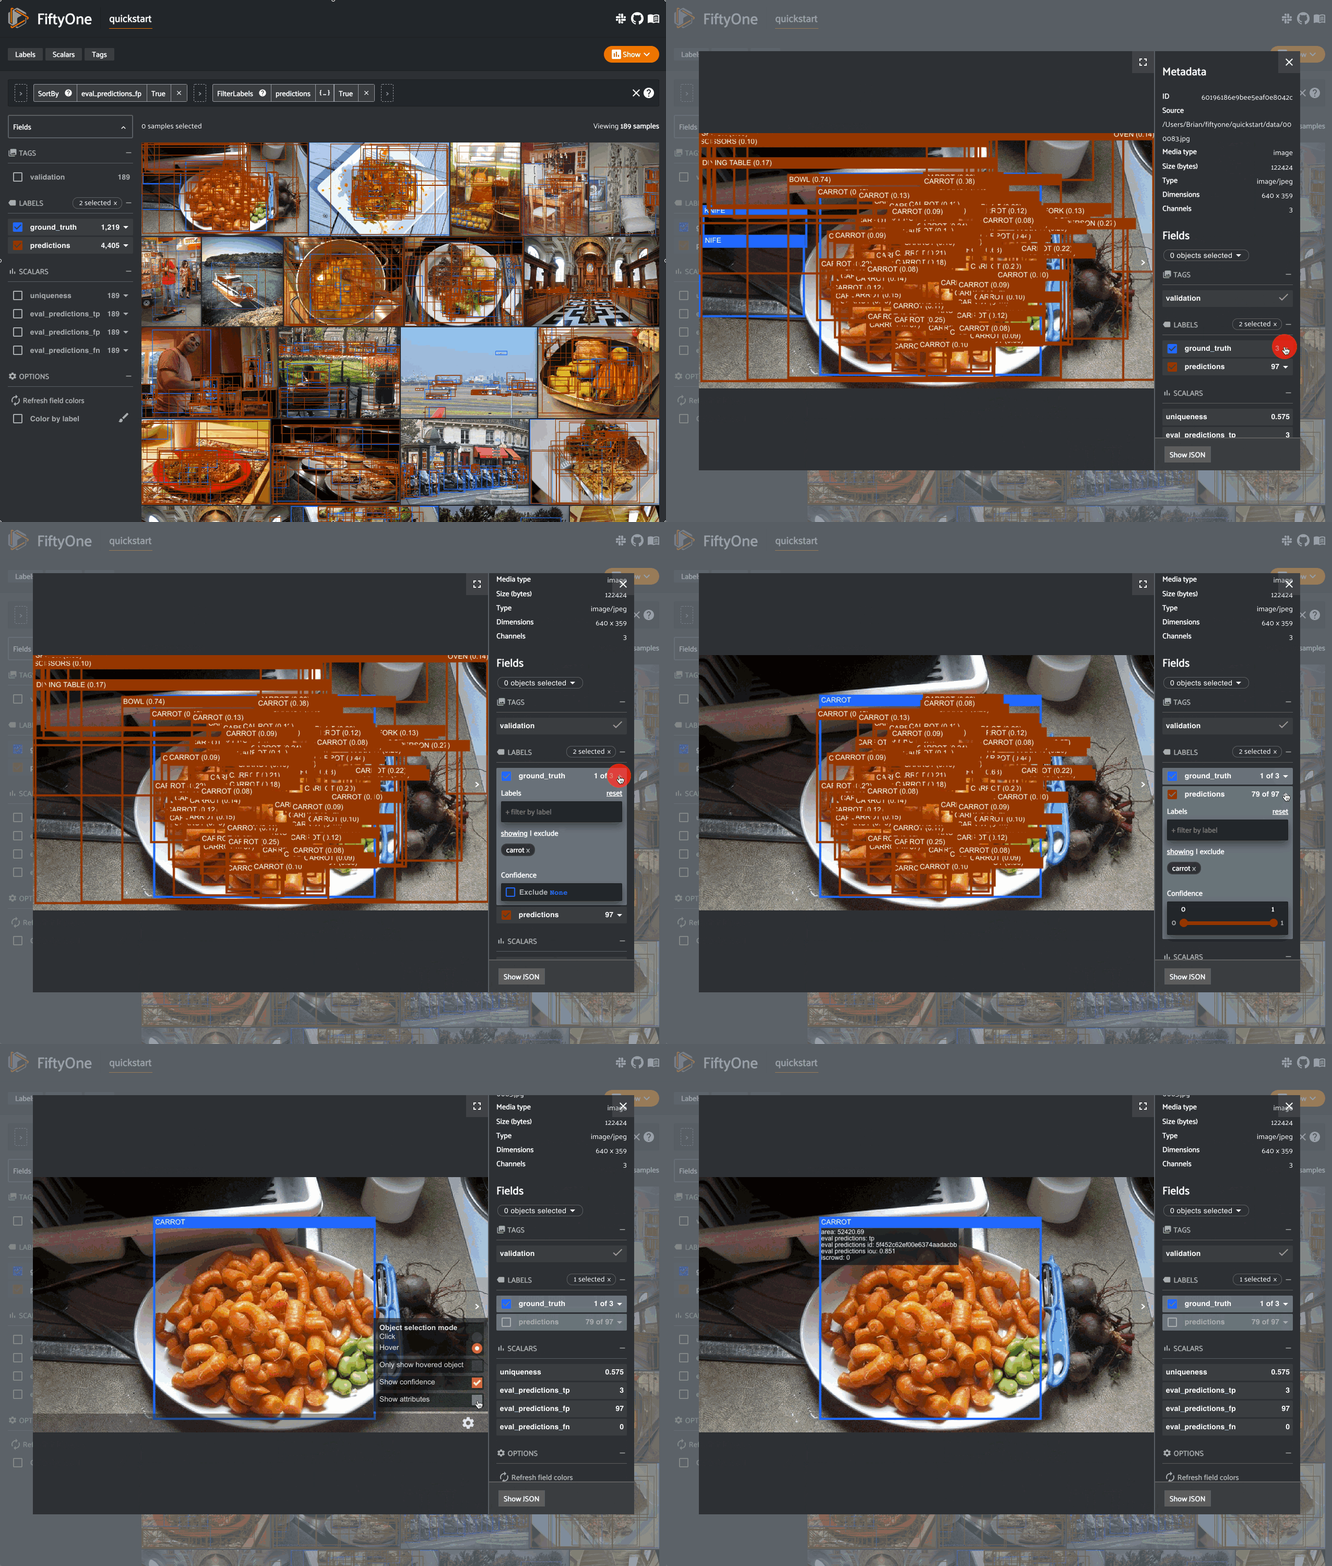
Notice anything wrong? The sample with the most false positives is a plate of
carrots where the entire plate has been boxed as a single example in the ground
truth while the model is generating predictions for individual carrots!
If you’re familiar with COCO format
(which is recognized by
evaluate_detections()
by default), you’ll notice that the issue here is that the iscrowd
attribute of this ground truth annotation has been incorrectly set to 0.
Resolving mistakes like these will provide a much more accurate picture of the
real performance of a model.
Confusion matrices#
Note
The easiest way to work with confusion matrices in FiftyOne is via the Model Evaluation panel!
When you use evaluation methods such as
evaluate_detections()
that support confusion matrices, you can use the
plot_confusion_matrix()
method to render responsive plots that can be attached to App instances to
interactively explore specific cases of your model’s performance:
1# Plot confusion matrix
2plot = results.plot_confusion_matrix(classes=classes)
3plot.show()
4
5# Connect to session
6session.plots.attach(plot)
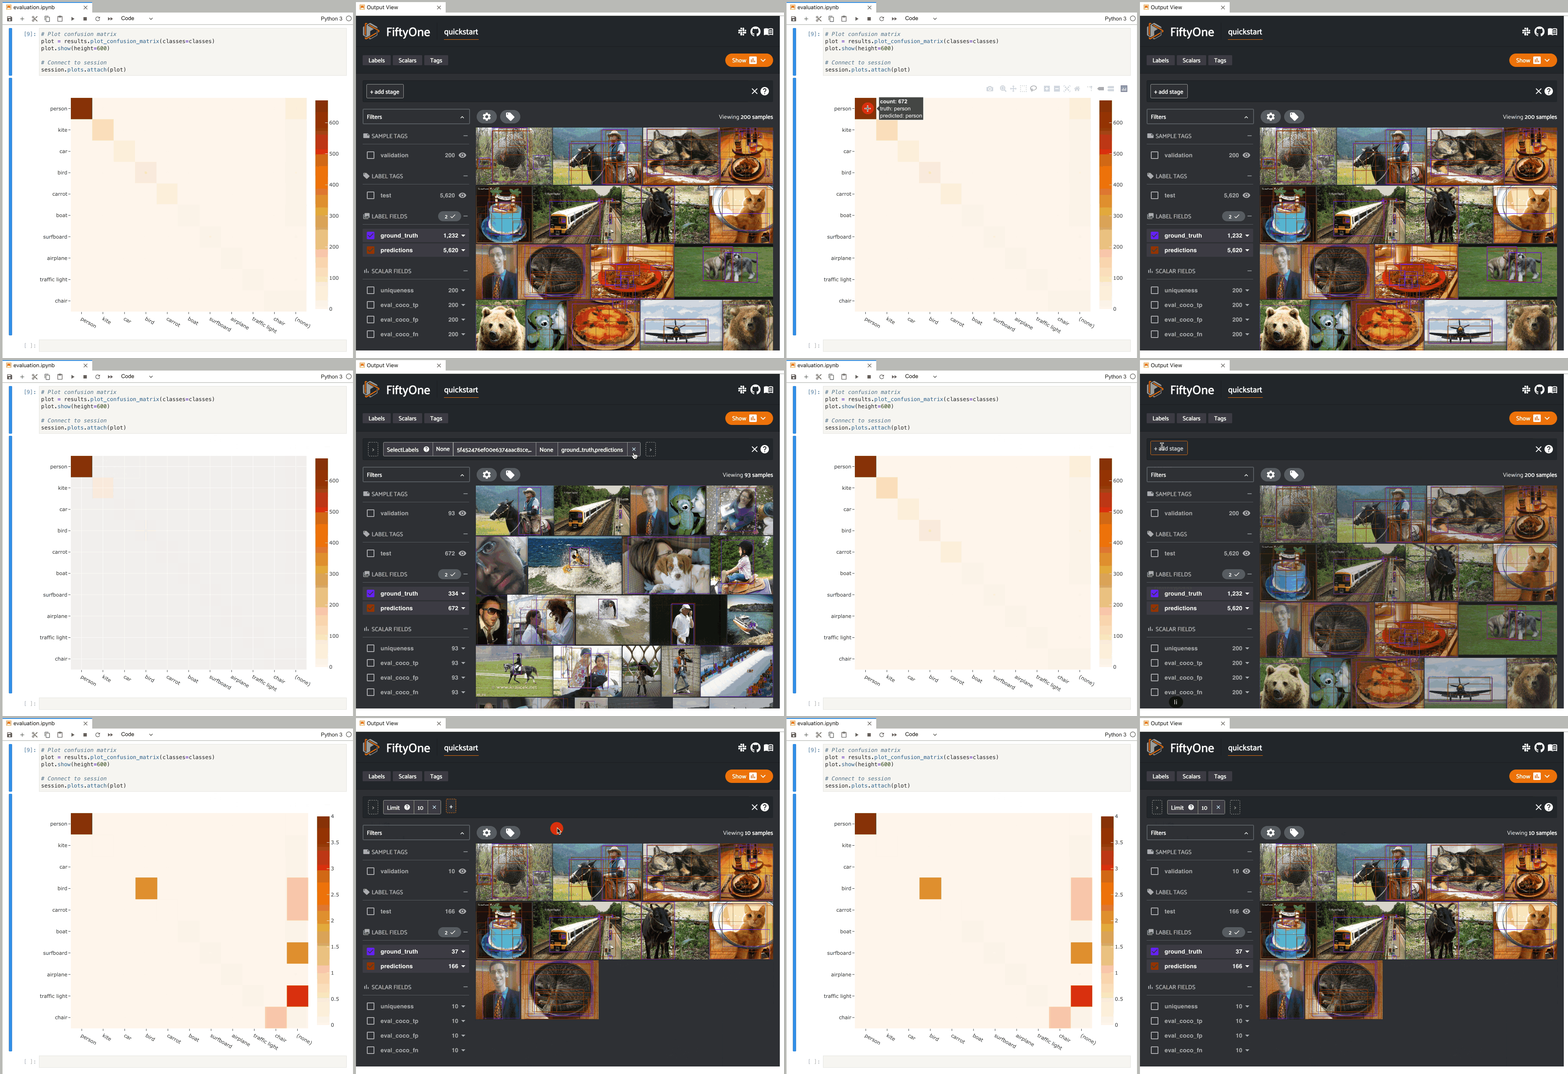
In this setup, you can click on individual cells of the confusion matrix to select the corresponding ground truth and/or predicted objects in the App. For example, if you click on a diagonal cell of the confusion matrix, you will see the true positive examples of that class in the App.
Likewise, whenever you modify the Session’s view, either in the App or by
programmatically setting
session.view, the confusion matrix
is automatically updated to show the cell counts for only those objects that
are included in the current view.
Analyzing scenarios#
Note
Did you know? You can create and analyze model evaluation scenarios in the App via the Scenario Analysis tab.
The use_subset()
method allows you to evaluate the performance of your model under specific
scenarios, i.e., subsets of the overall dataset on which evaluation was
performed.
Consider the following example:
 1import fiftyone as fo
 2import fiftyone.zoo as foz
 3import fiftyone.utils.random as four
 4from fiftyone import ViewField as F
 5
 6dataset = foz.load_zoo_dataset("quickstart")
 7
 8four.random_split(dataset, {"sunny": 0.7, "cloudy": 0.2, "rainy": 0.1})
 9
10counts = dataset.count_values("ground_truth.detections.label")
11classes = sorted(counts, key=counts.get, reverse=True)[:5]
12
13dataset.save_view("take100", dataset.take(100))
14
15results = dataset.evaluate_detections(
16    "predictions",
17    gt_field="ground_truth",
18    eval_key="eval",
19)
By default, invoking methods on an EvaluationResults instance reports
statistics across the entire evaluation:
1# Full results
2results.print_report(classes=classes)
              precision    recall  f1-score   support

      person       0.52      0.94      0.67       716
        kite       0.59      0.88      0.71       140
         car       0.18      0.80      0.29        61
        bird       0.65      0.78      0.71       110
      carrot       0.09      0.74      0.16        47

   micro avg       0.42      0.90      0.57      1074
   macro avg       0.41      0.83      0.51      1074
weighted avg       0.51      0.90      0.64      1074
However, you can use
use_subset()
to analyze the performance of the model on specific subsets of interest:
1# Sunny samples
2subset_def = dict(type="field", field="tags", value="sunny")
3with results.use_subset(subset_def):
4    results.print_report(classes=classes)
              precision    recall  f1-score   support

      person       1.00      0.93      0.96       495
        kite       1.00      0.90      0.95        62
         car       1.00      0.69      0.81        35
        bird       1.00      0.78      0.88       104
      carrot       1.00      0.69      0.82        36

   micro avg       1.00      0.88      0.94       732
   macro avg       1.00      0.80      0.88       732
weighted avg       1.00      0.88      0.94       732
1# Small objects
2bbox_area = F("bounding_box")[2] * F("bounding_box")[3]
3small_objects = bbox_area <= 0.05
4subset_def = dict(type="attribute", expr=small_objects)
5with results.use_subset(subset_def):
6    results.print_report(classes=classes)
              precision    recall  f1-score   support

      person       1.00      0.87      0.93       324
        kite       1.00      0.76      0.87        72
         car       1.00      0.79      0.88        56
        bird       1.00      0.52      0.69        46
      carrot       1.00      0.75      0.86        40

   micro avg       1.00      0.81      0.89       538
   macro avg       1.00      0.74      0.84       538
weighted avg       1.00      0.81      0.89       538
1# Saved view
2subset_def = dict(type="view", view="take100")
3with results.use_subset(subset_def):
4    results.print_report(classes=classes)
              precision    recall  f1-score   support

      person       1.00      0.94      0.97       292
        kite       1.00      0.93      0.97        15
         car       1.00      0.87      0.93        15
        bird       1.00      0.35      0.52        23
      carrot       1.00      0.67      0.80         9

   micro avg       1.00      0.89      0.94       354
   macro avg       1.00      0.75      0.84       354
weighted avg       1.00      0.89      0.93       354
1# Sunny samples + small objects
2subset_def = [
3    dict(type="field", field="tags", value="sunny"),
4    dict(type="attribute", expr=small_objects),
5]
6with results.use_subset(subset_def):
7    results.print_report(classes=classes)
              precision    recall  f1-score   support

      person       1.00      0.85      0.92       227
        kite       1.00      0.87      0.93        45
         car       1.00      0.66      0.79        32
        bird       1.00      0.48      0.65        42
      carrot       1.00      0.71      0.83        31

   micro avg       1.00      0.79      0.88       377
   macro avg       1.00      0.71      0.82       377
weighted avg       1.00      0.79      0.87       377
Refer to
use_subset()
and
get_subset_view() for a
complete description of the supported syntax for defining subsets to analyze.
Managing evaluations#
When you run an evaluation with an eval_key argument, the evaluation is
recorded on the dataset and you can retrieve information about it later, rename
it, delete it (along with any modifications to your dataset that were performed
by it), and retrieve the view that you evaluated
on using the following methods on your dataset:
The example below demonstrates the basic interface:
 1# List evaluations you've run on a dataset
 2dataset.list_evaluations()
 3# ['eval']
 4
 5# Print information about an evaluation
 6print(dataset.get_evaluation_info("eval"))
 7
 8# Load existing evaluation results and use them
 9results = dataset.load_evaluation_results("eval")
10results.print_report()
11
12# Rename the evaluation
13# This will automatically rename any evaluation fields on your dataset
14dataset.rename_evaluation("eval", "still_eval")
15
16# Delete the evaluation
17# This will remove any evaluation data that was populated on your dataset
18dataset.delete_evaluation("still_eval")
Model Evaluation panel#
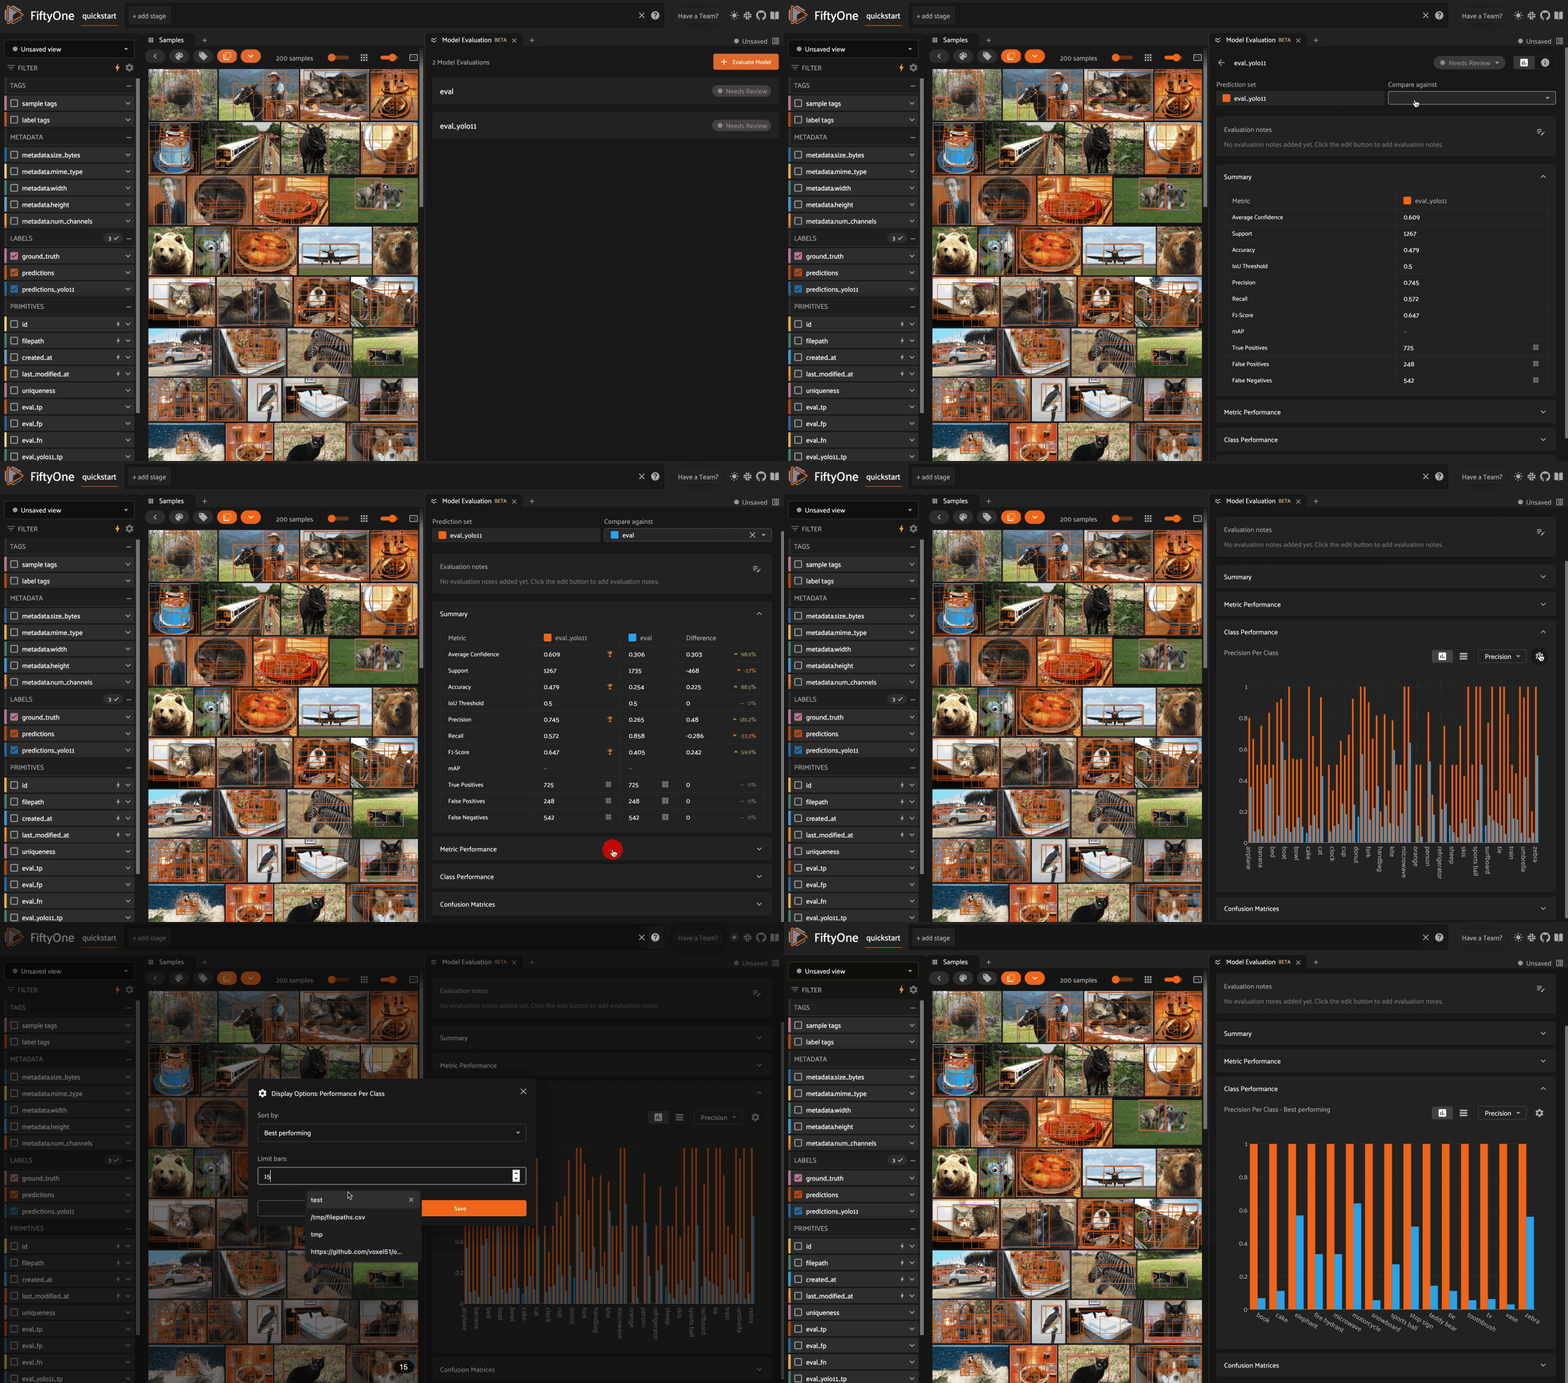
When you load a dataset in the App that contains one or more evaluations, you can open the Model Evaluation panel to visualize and interactively explore the evaluation results in the App:
Note
Did you know? With Voxel51 you can execute model evaluations natively from the App in the background while you work.