FiftyOne Enterprise Plugins#
FiftyOne Enterprise provides native support for installing and running FiftyOne plugins, which offers powerful opportunities to extend and customize the functionality of your Enterprise deployment to suit your needs.
Note
What can you do with plugins? Check out delegated operations to see some quick examples, then check out the Plugins Ecosystem for a growing collection of plugins that you can add to your Enterprise deployment!
Plugins page#
Admins can use the plugins page to upload, manage, and configure permissions for plugins that are made available to users of your Enterprise deployment.
Note
Want to build your own plugin? See the Developing plugins guide.
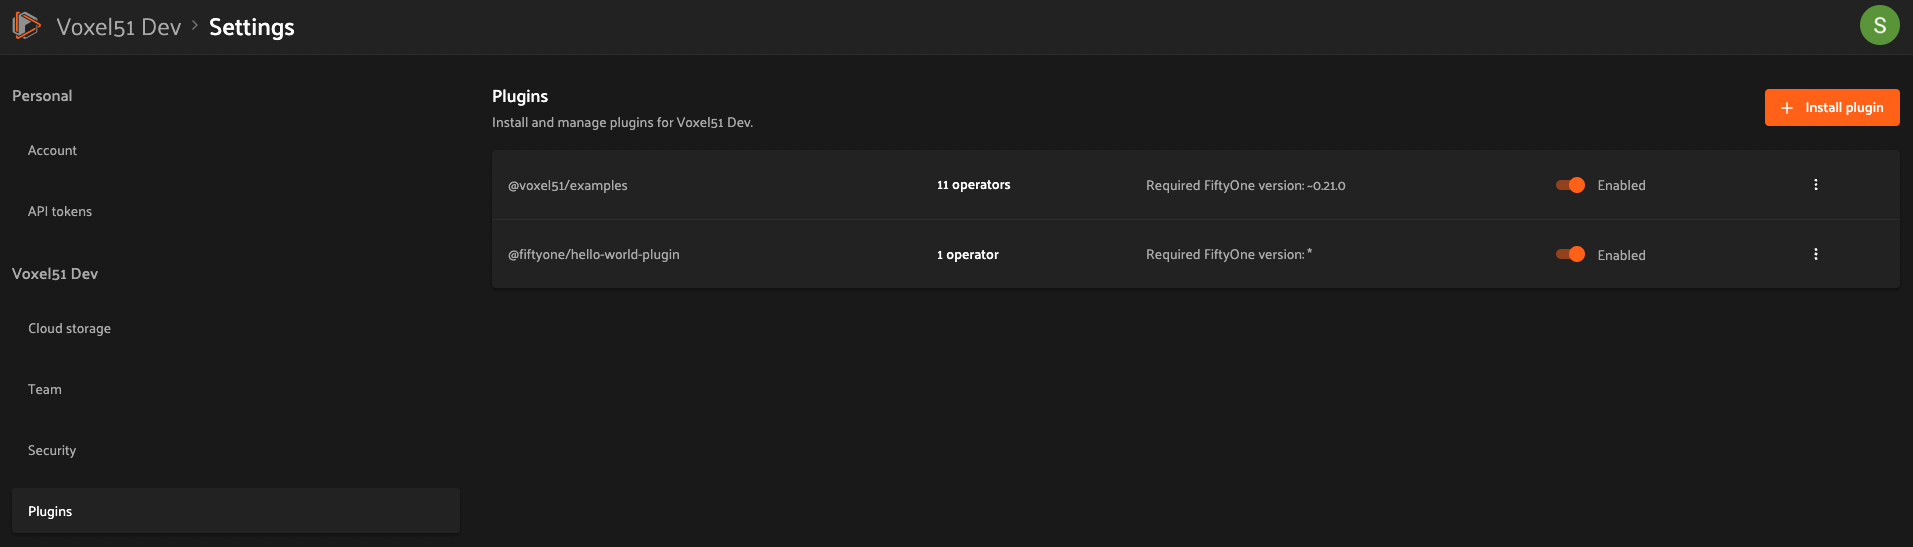
Admins can access the plugins page under Settings > Plugins. It displays a list of all installed plugins and their operators, as well as the enablement and permissions of each.
Installing a plugin#
Admins can install plugins via the Enterprise UI or Management SDK.
Note
A plugin is a directory (or ZIP of it) that contains a top-level
fiftyone.yml file.
Enterprise UI#
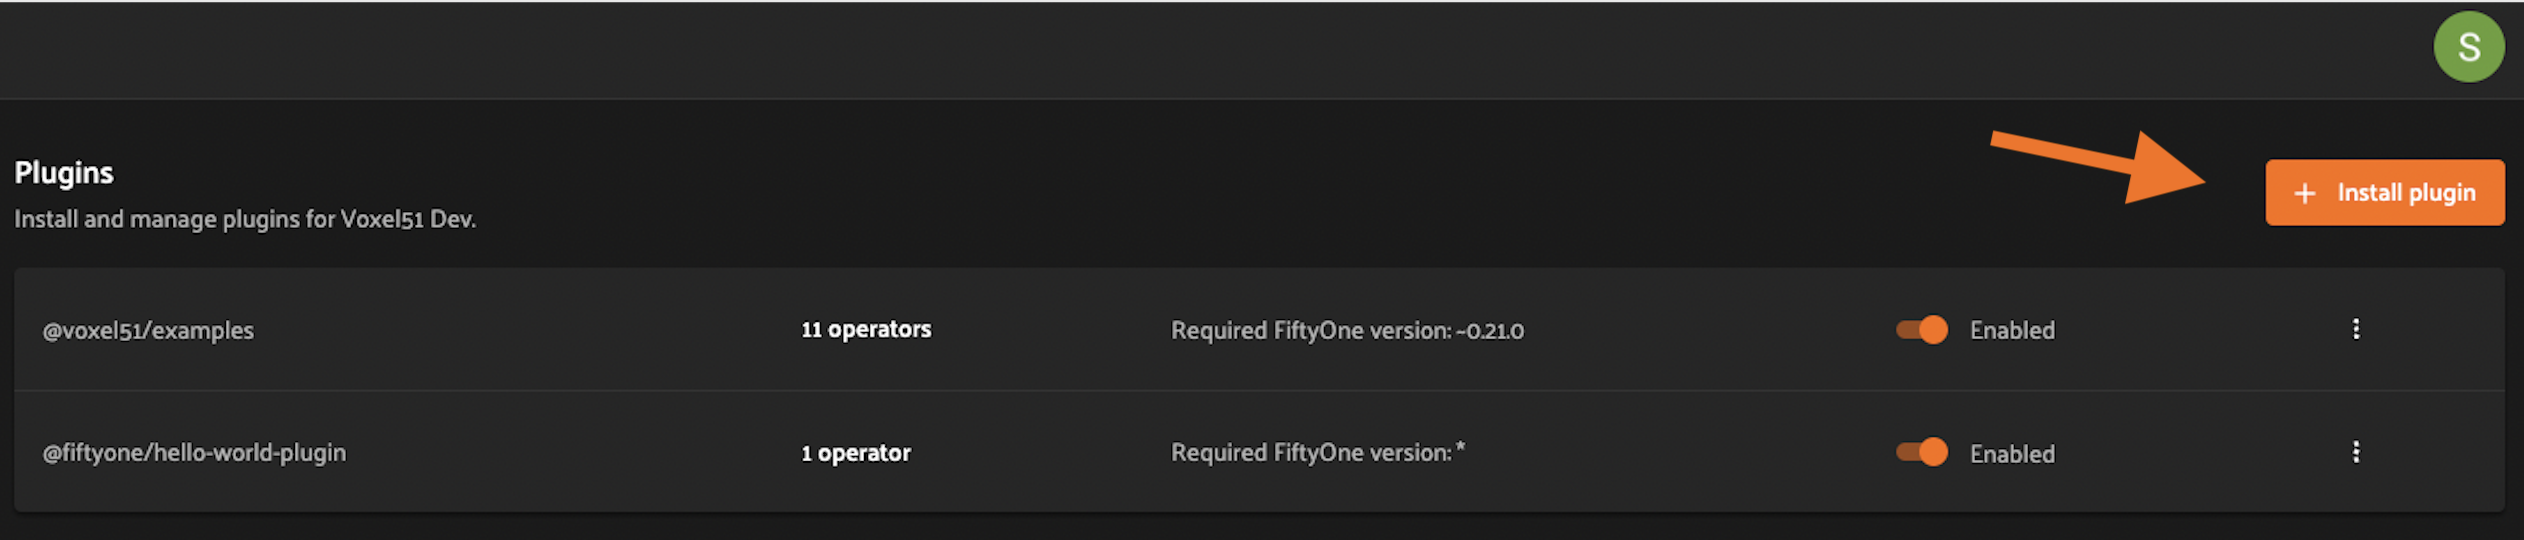
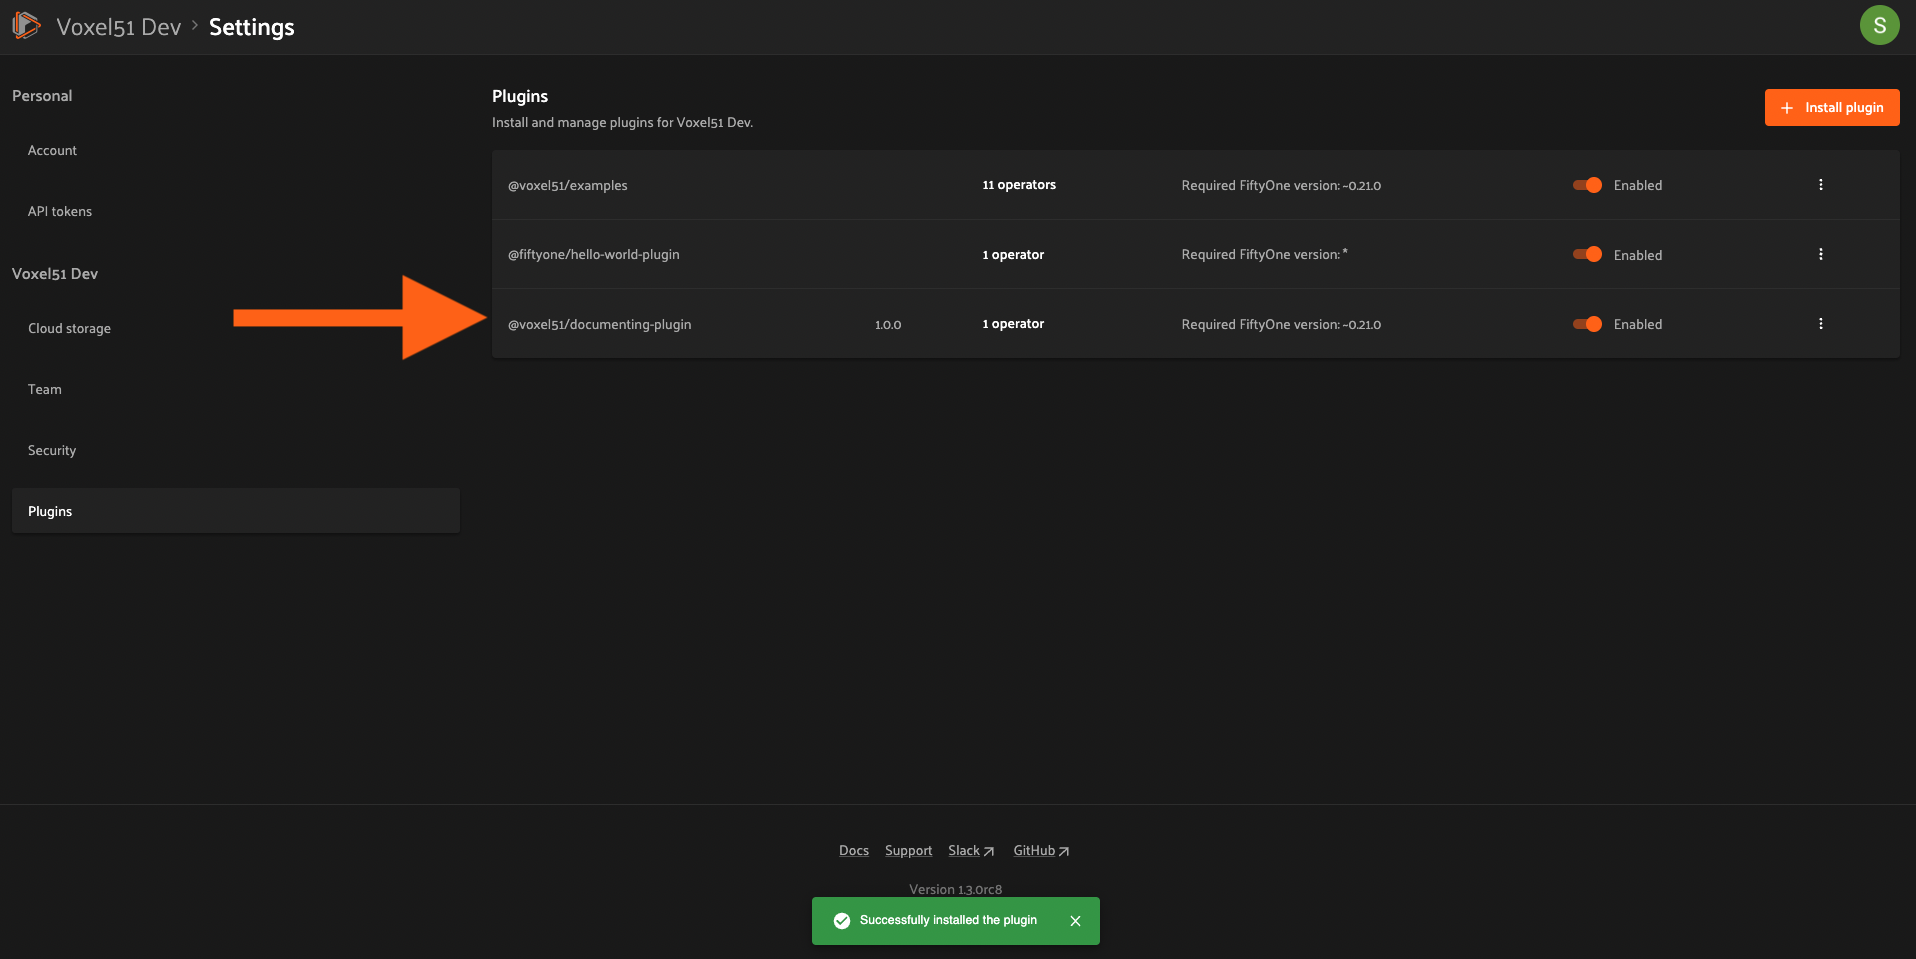
To install a plugin, click the “Install plugin” button on the plugins page.
Then upload or drag and drop the plugin contents as a ZIP file and click install.
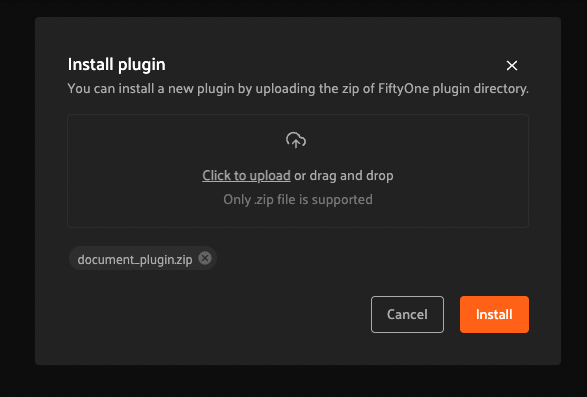
You should then see a success message and the newly installed plugin listed on the plugins page.
SDK#
Admins can also use the
upload_plugin() method from
the Management SDK:
1import fiftyone.management as fom
2
3# You can pass the directory or an already zipped version of it
4fom.upload_plugin("/path/to/plugin_dir")
Upgrading a plugin#
Admins can upgrade plugins at any time through the Enterprise UI or Management SDK.
Enterprise UI#
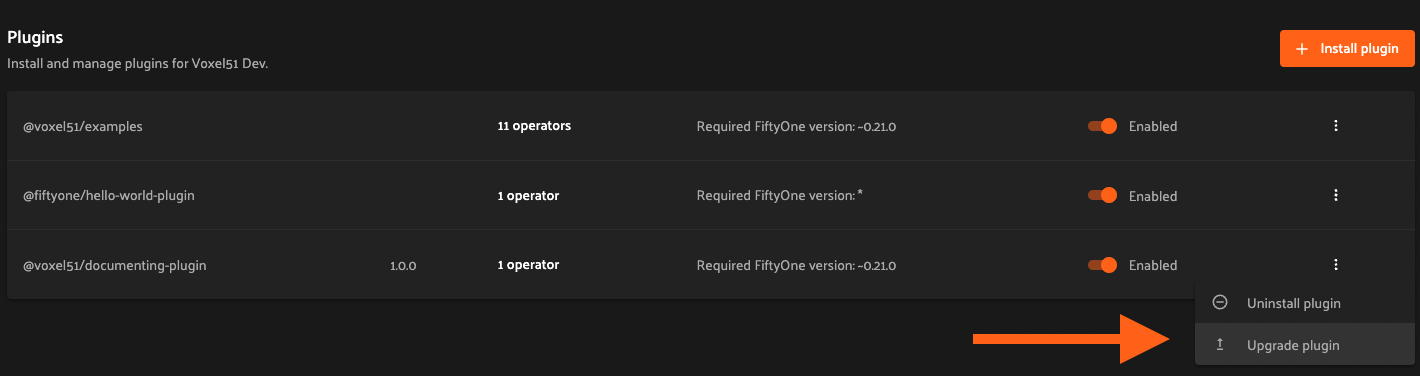
To upgrade a plugin, click the plugin’s dropdown and select “Upgrade plugin”.
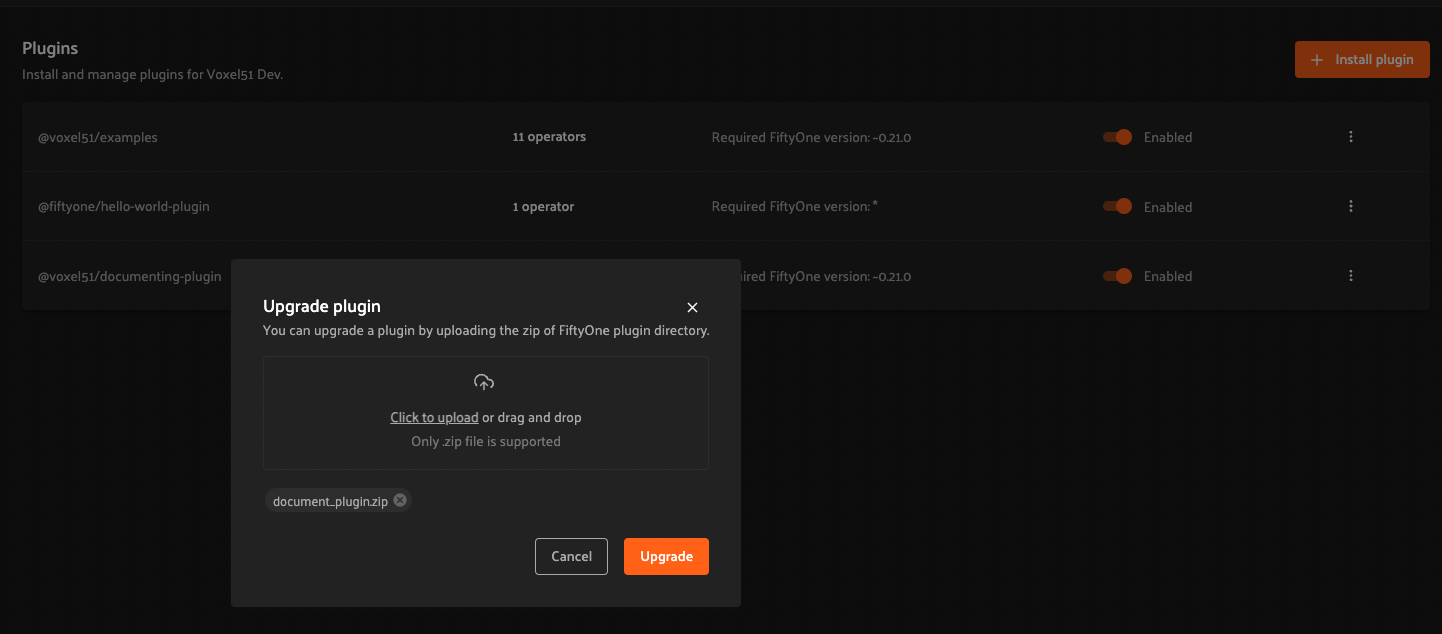
Then upload or drag and drop the upgraded plugin as a ZIP file and click upgrade.
Note
If the name attribute within the uploaded plugin’s fiftyone.yml file
doesn’t match the existing plugin, a new plugin will be created. Simply
delete the old one.
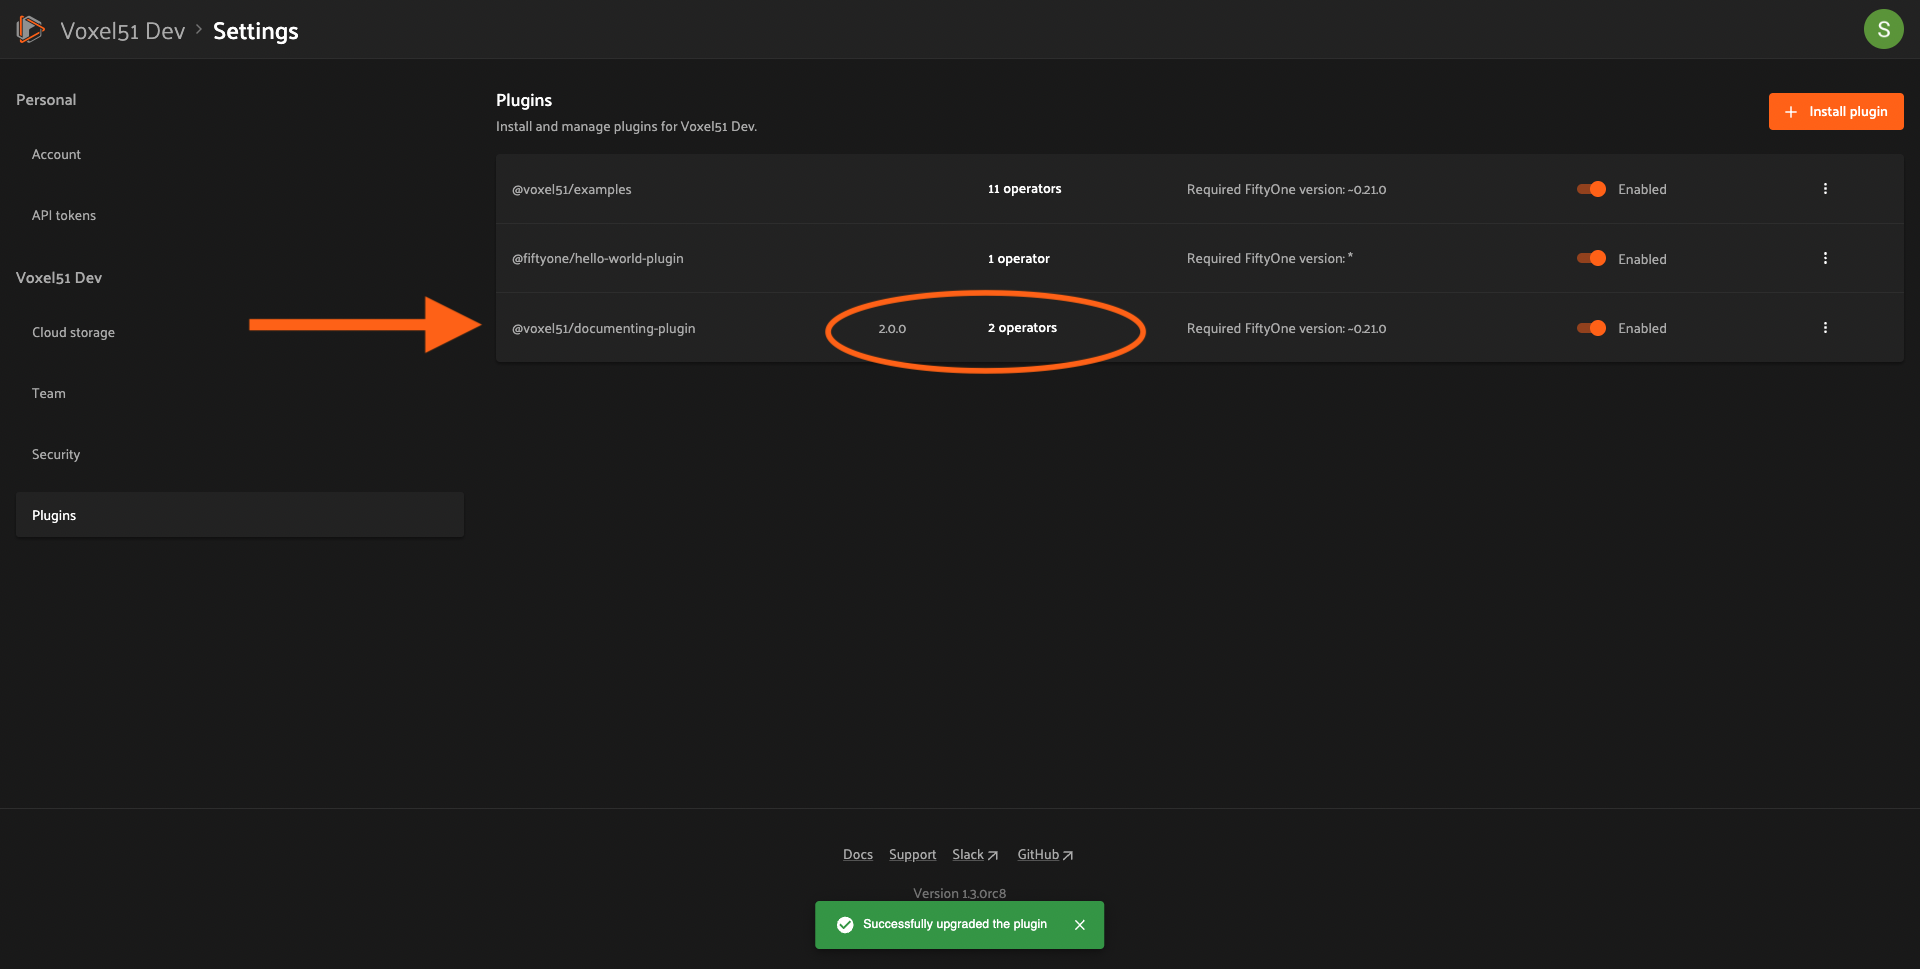
You should then see a success message and the updated information about the plugin on the plugins page.
SDK#
Admins can also use the
upload_plugin() method from
the Management SDK with the overwrite=True option:
1import fiftyone.management as fom
2
3# You can pass the directory or an already zipped version of it
4fom.upload_plugin("/path/to/plugin_dir", overwrite=True)
Uninstalling a plugin#
Admins can uninstall plugins at any time through the Enterprise UI or Management SDK.
Note
Did you know? You can enable/disable plugins rather than permanently uninstalling them.
Enterprise UI#
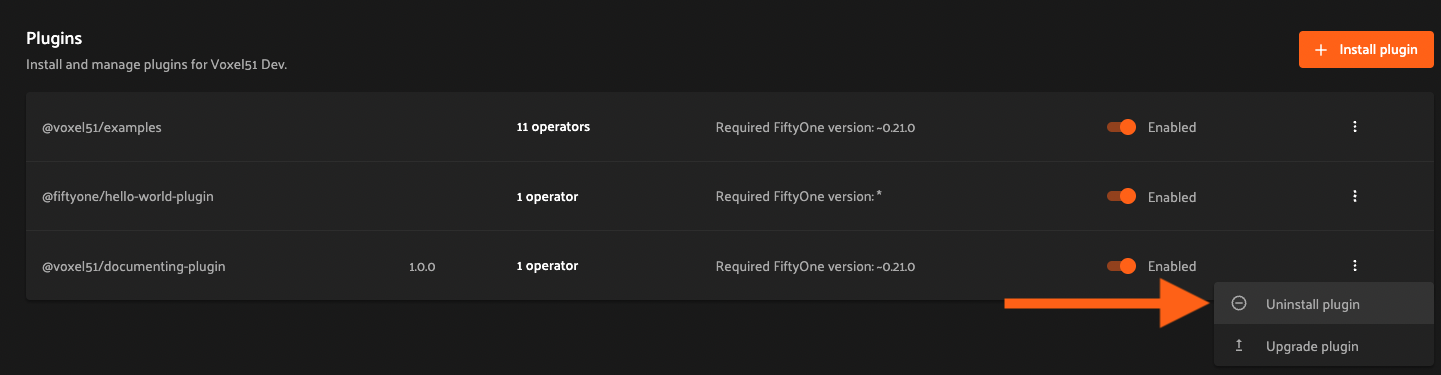
To uninstall a plugin, click the plugin’s dropdown and select “Uninstall plugin”.
SDK#
Admins can also use the
delete_plugin() method from
the Management SDK:
1import fiftyone.management as fom
2
3fom.delete_plugin(plugin_name)
Enabling/disabling plugins#
Enterprise UI#
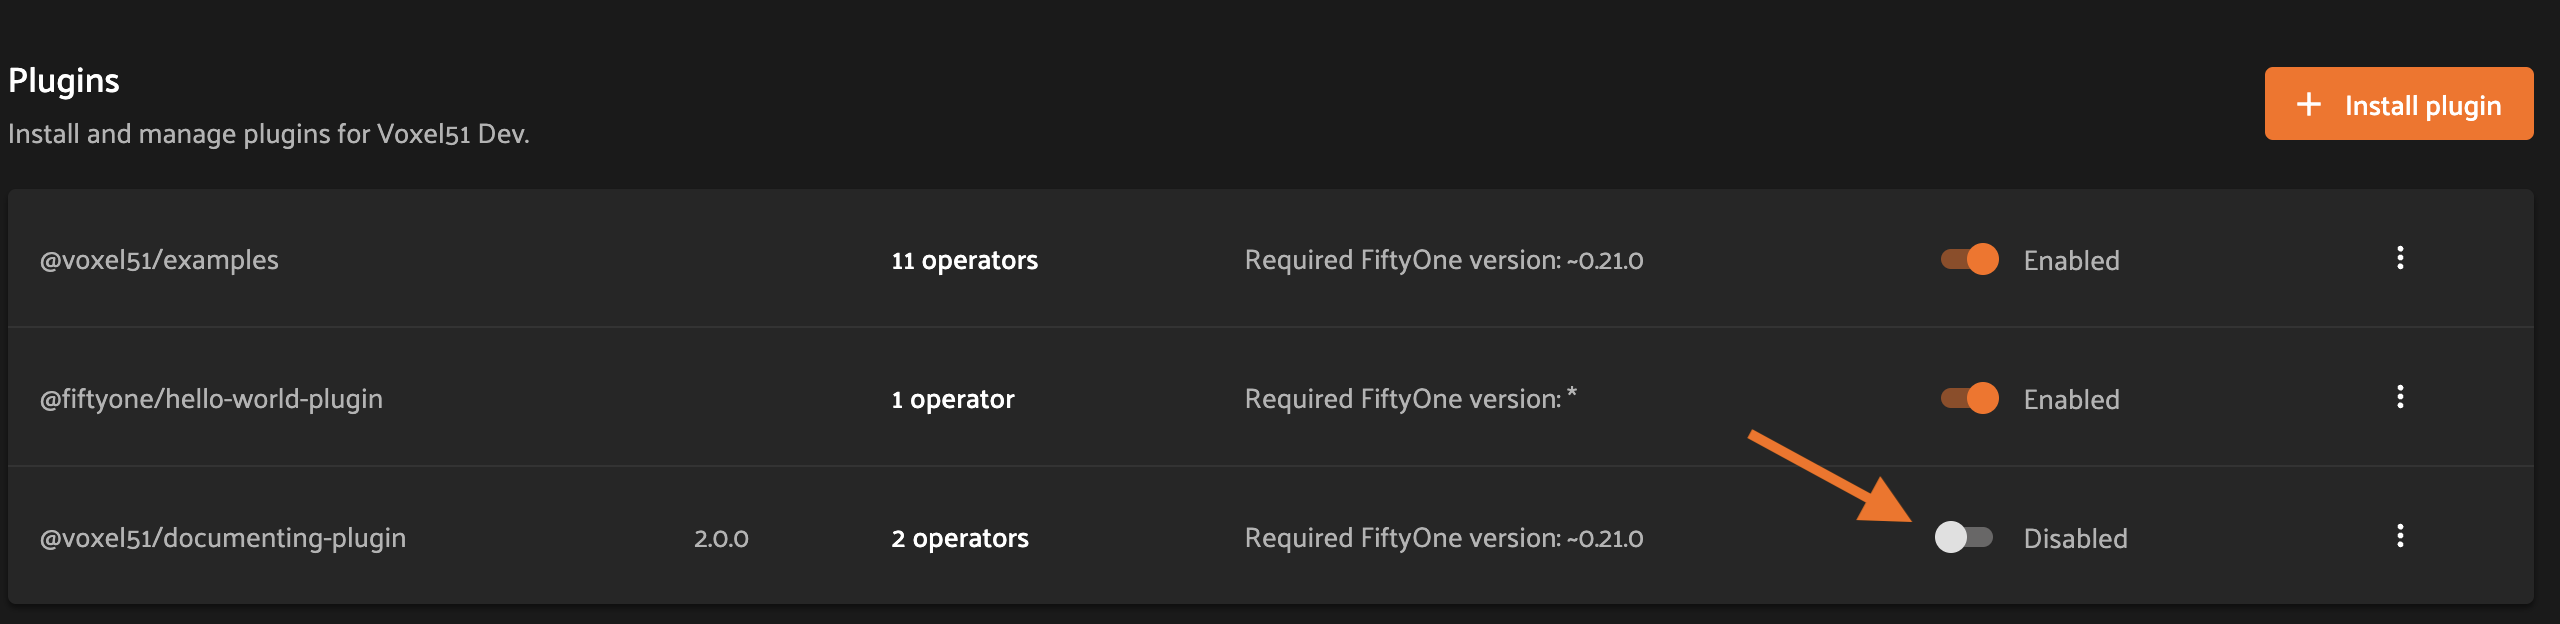
When plugins are first installed into Enterprise, they are enabled by default, along with any operators they contain.
Admins can enable/disable a plugin and all of its operators by toggling the enabled/disabled switch.
Admins can also disable/enable specific operators within an (enabled) plugin by clicking on the plugin’s operators link.
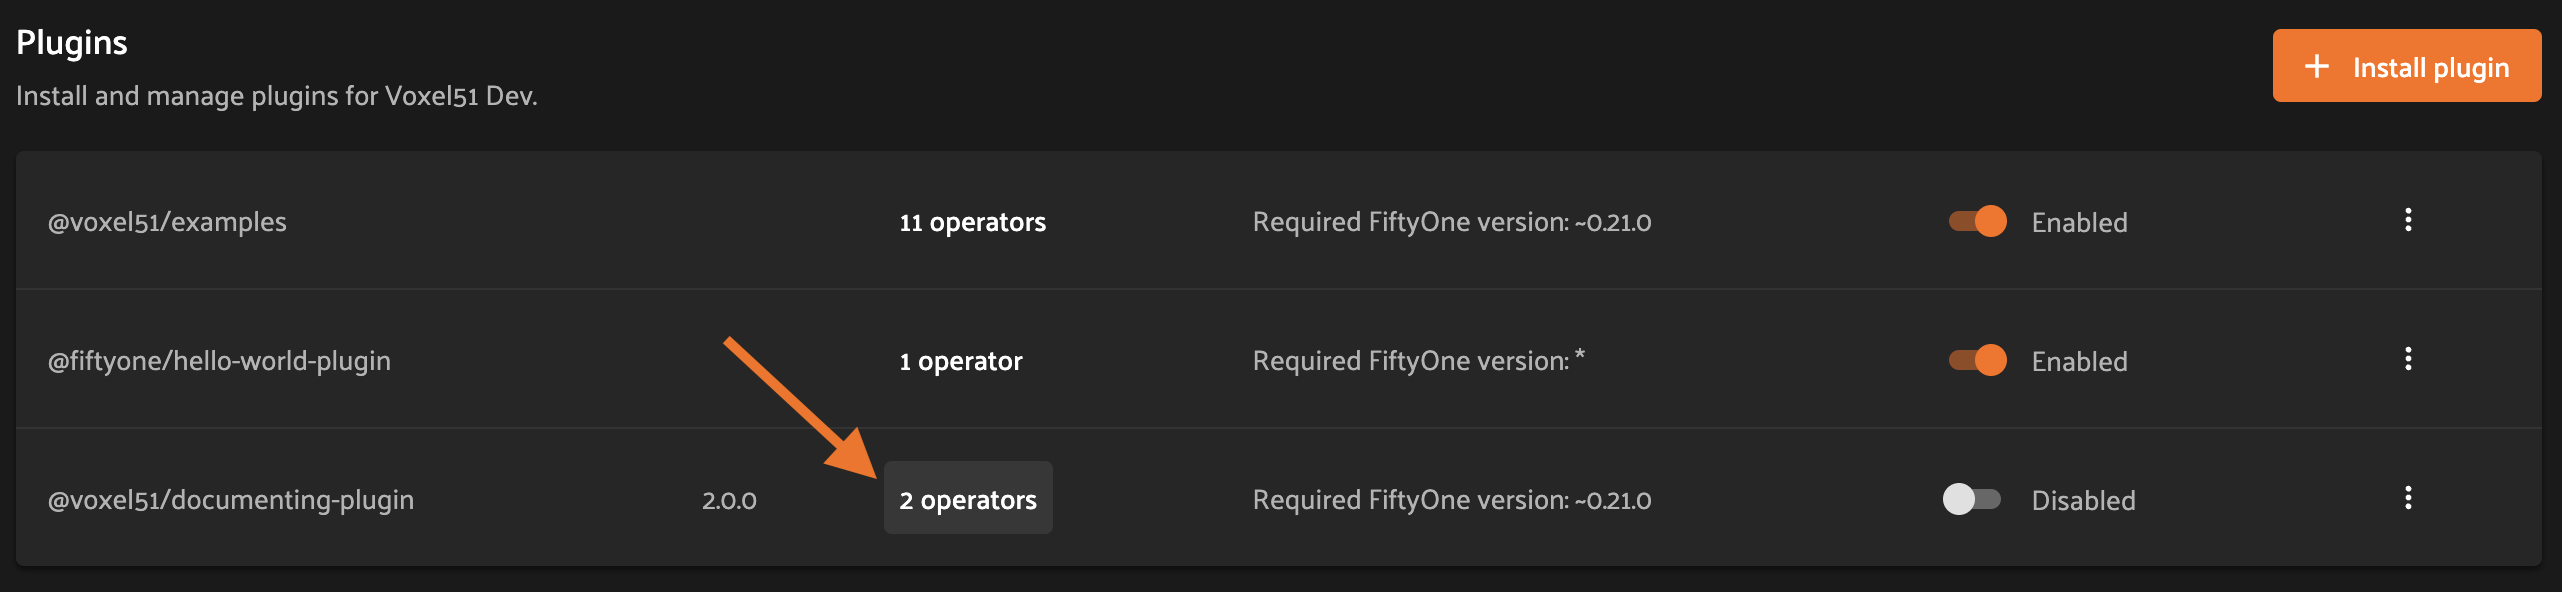
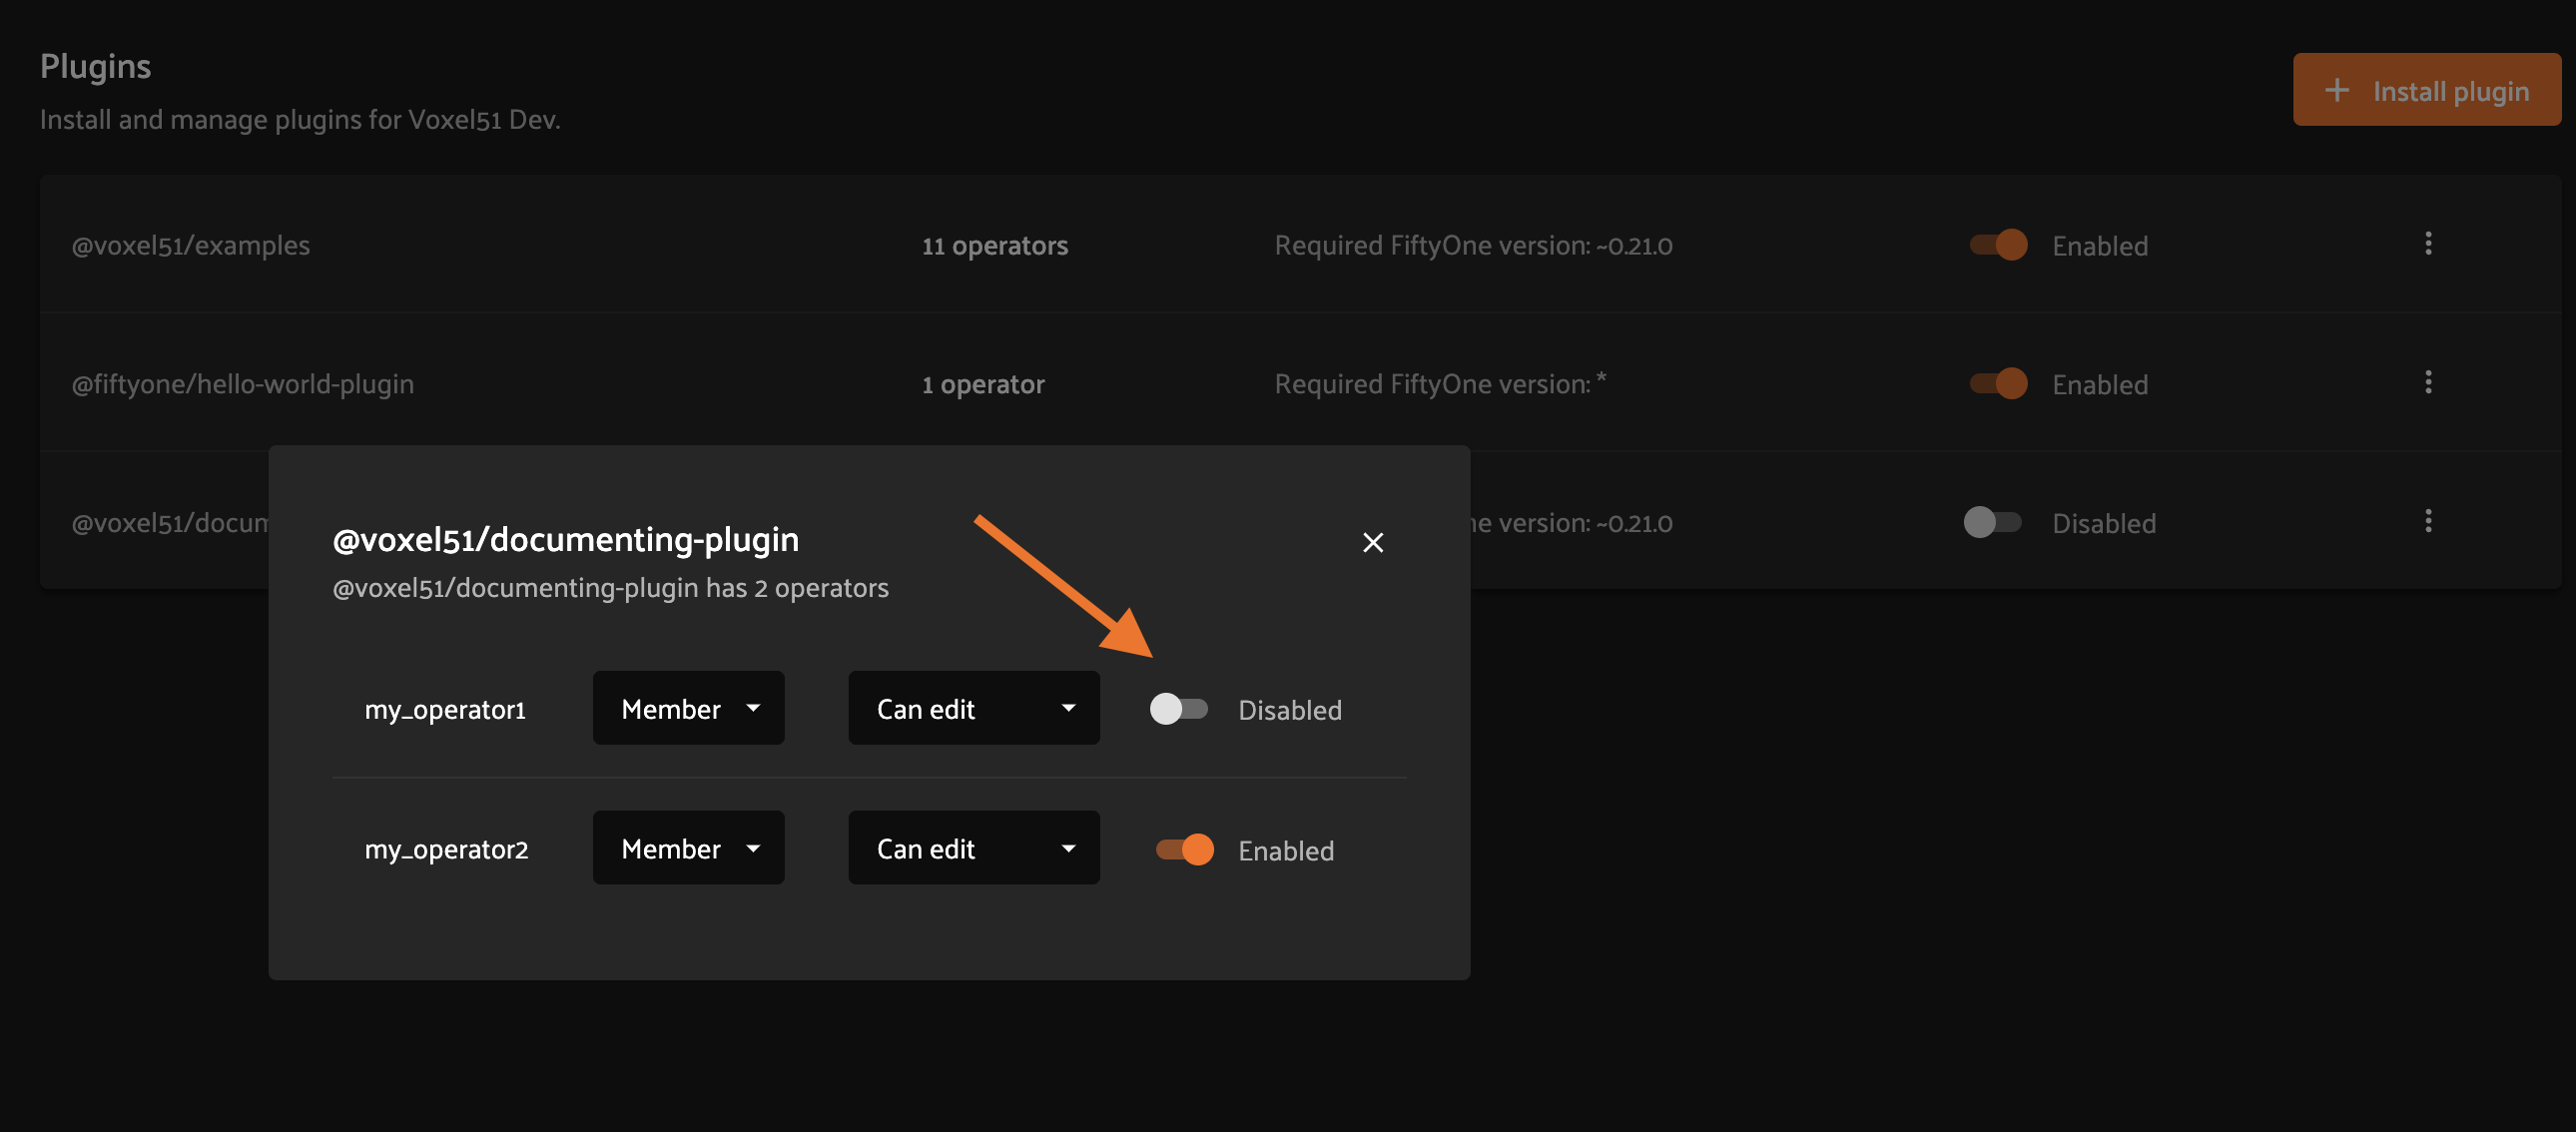
and then toggling the enabled/disabled switch for each operator as necessary.
SDK#
Admins can also use the
set_plugin_enabled()
and
set_plugin_operator_enabled()
methods from the management SDK:
1import fiftyone.management as fom
2
3# Disable a plugin
4fom.set_plugin_enabled(plugin_name, False)
5
6# Disable a particular operator
7fom.set_plugin_operator_enabled(plugin_name, operator_name, False)
Plugin permissions#
Admins can optionally configure access to plugins and individual operators within them via any combination of the permissions described below:
Permission |
Description |
|---|---|
Minimum Role |
The minimum role a user must have to execute the operation. |
Minimum Dataset Permission |
The minimum dataset permission a user must have to perform the operation on a particular dataset. |
Enterprise UI#
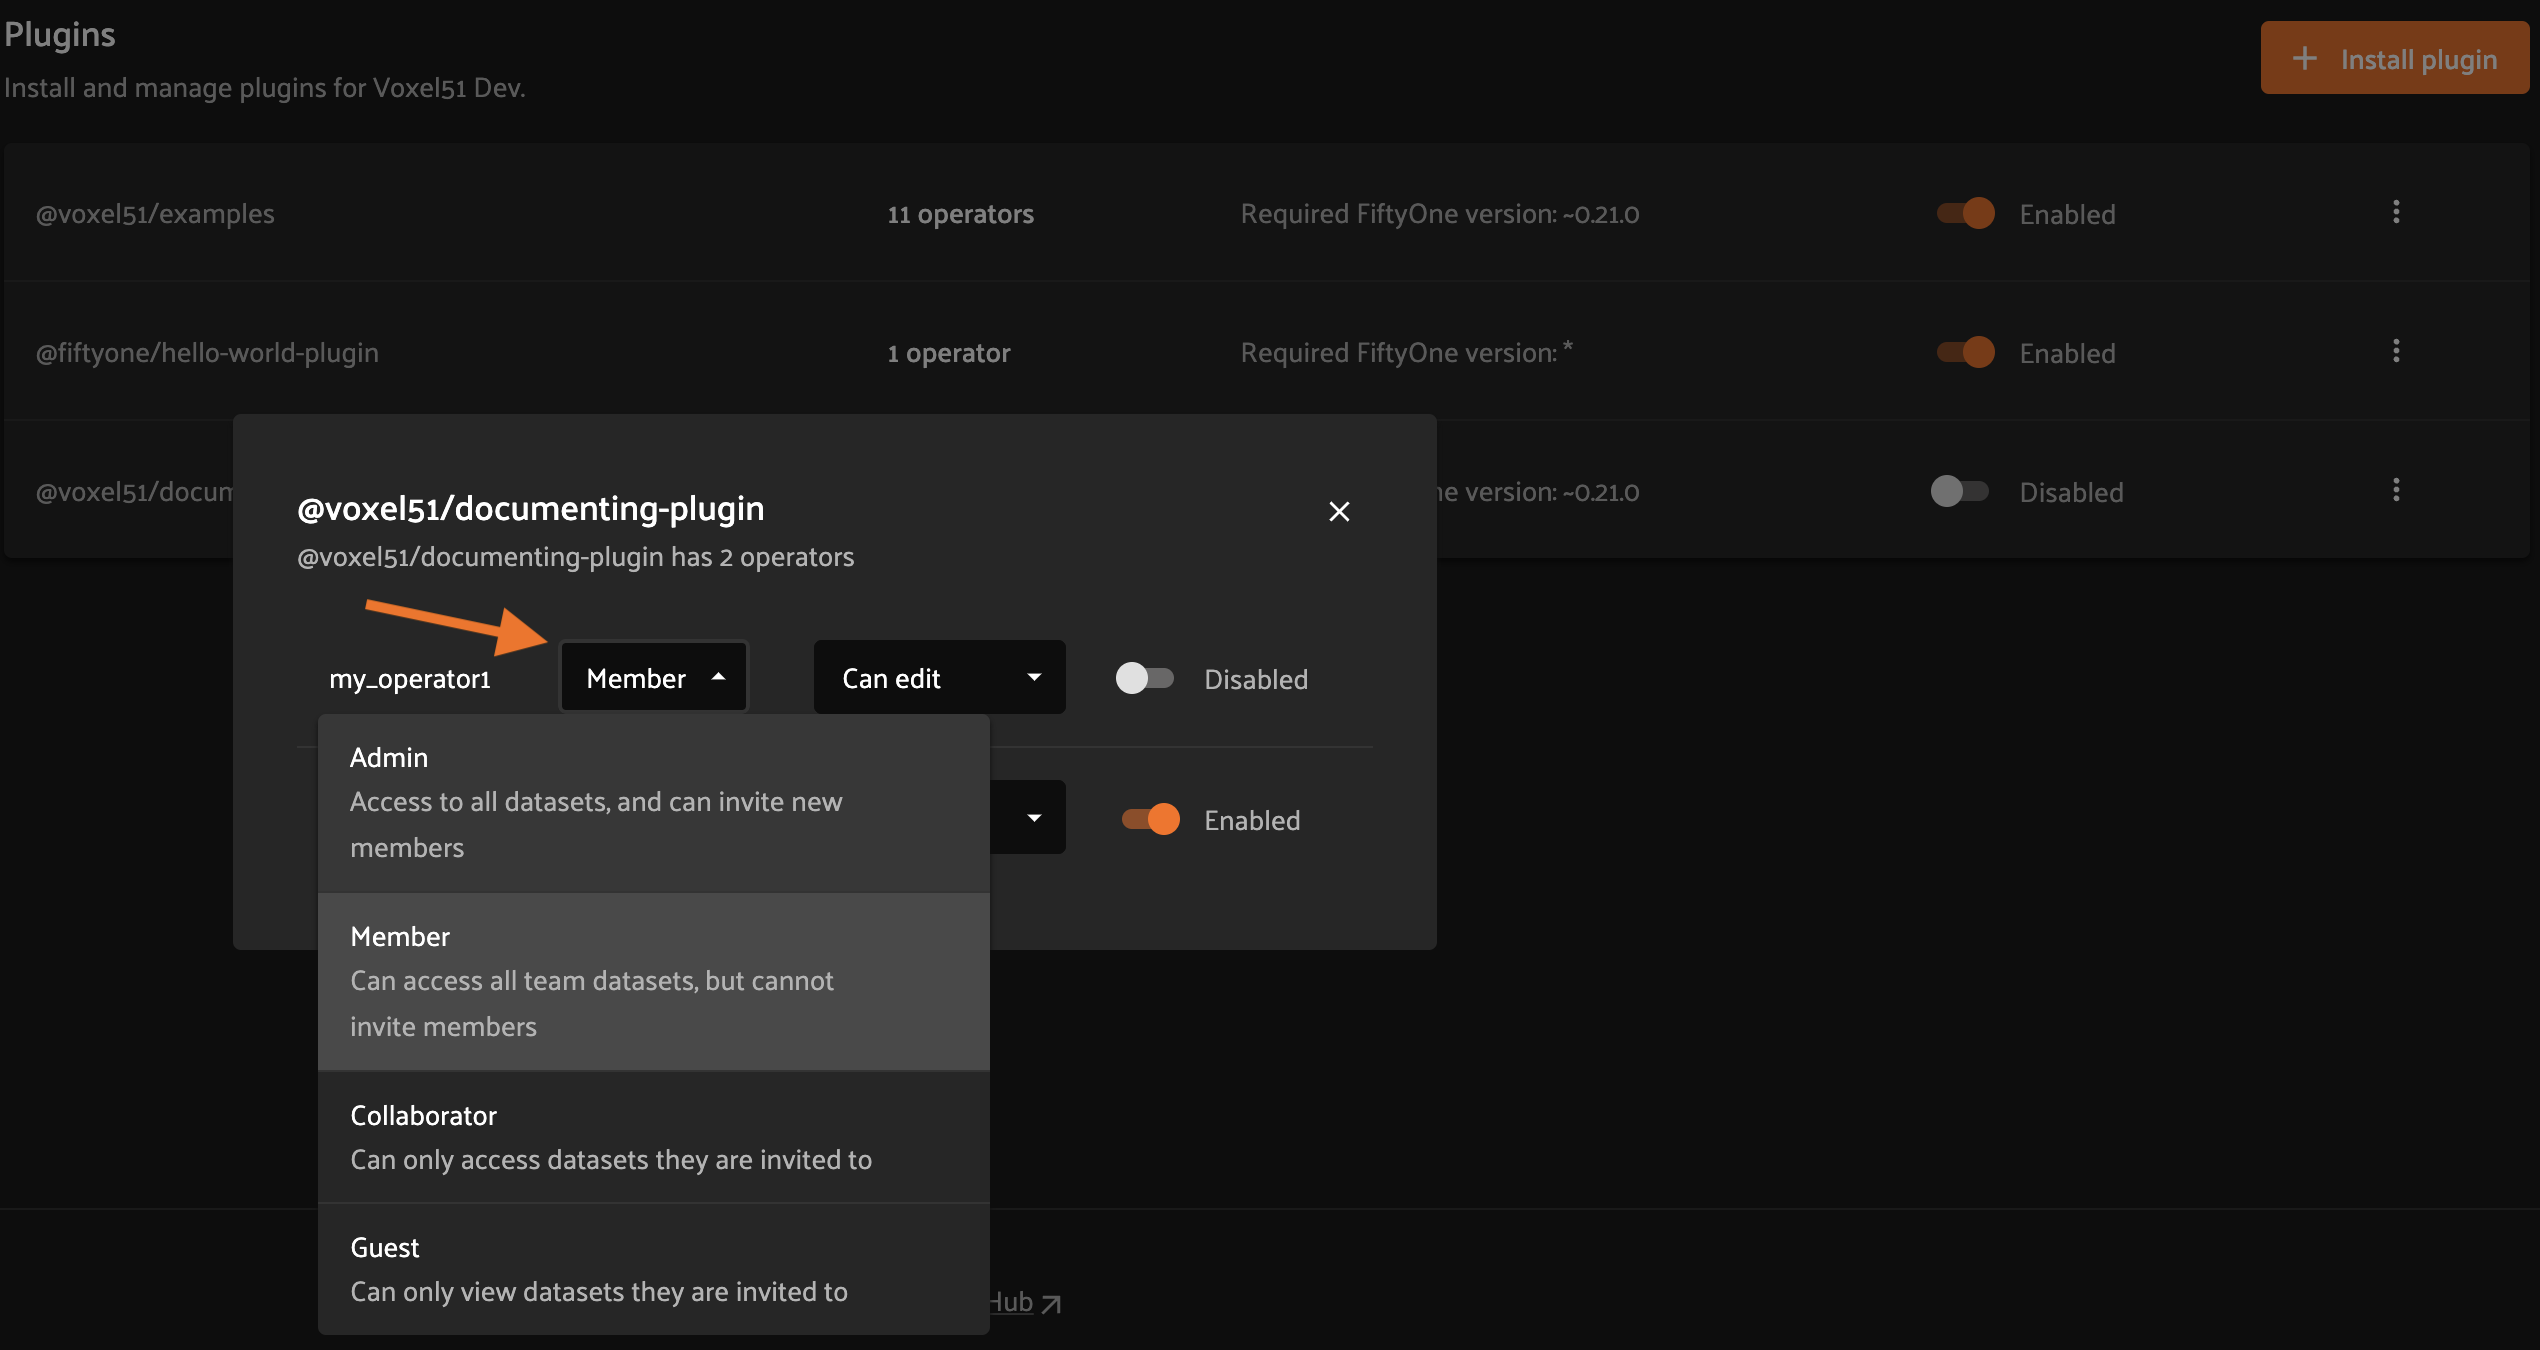
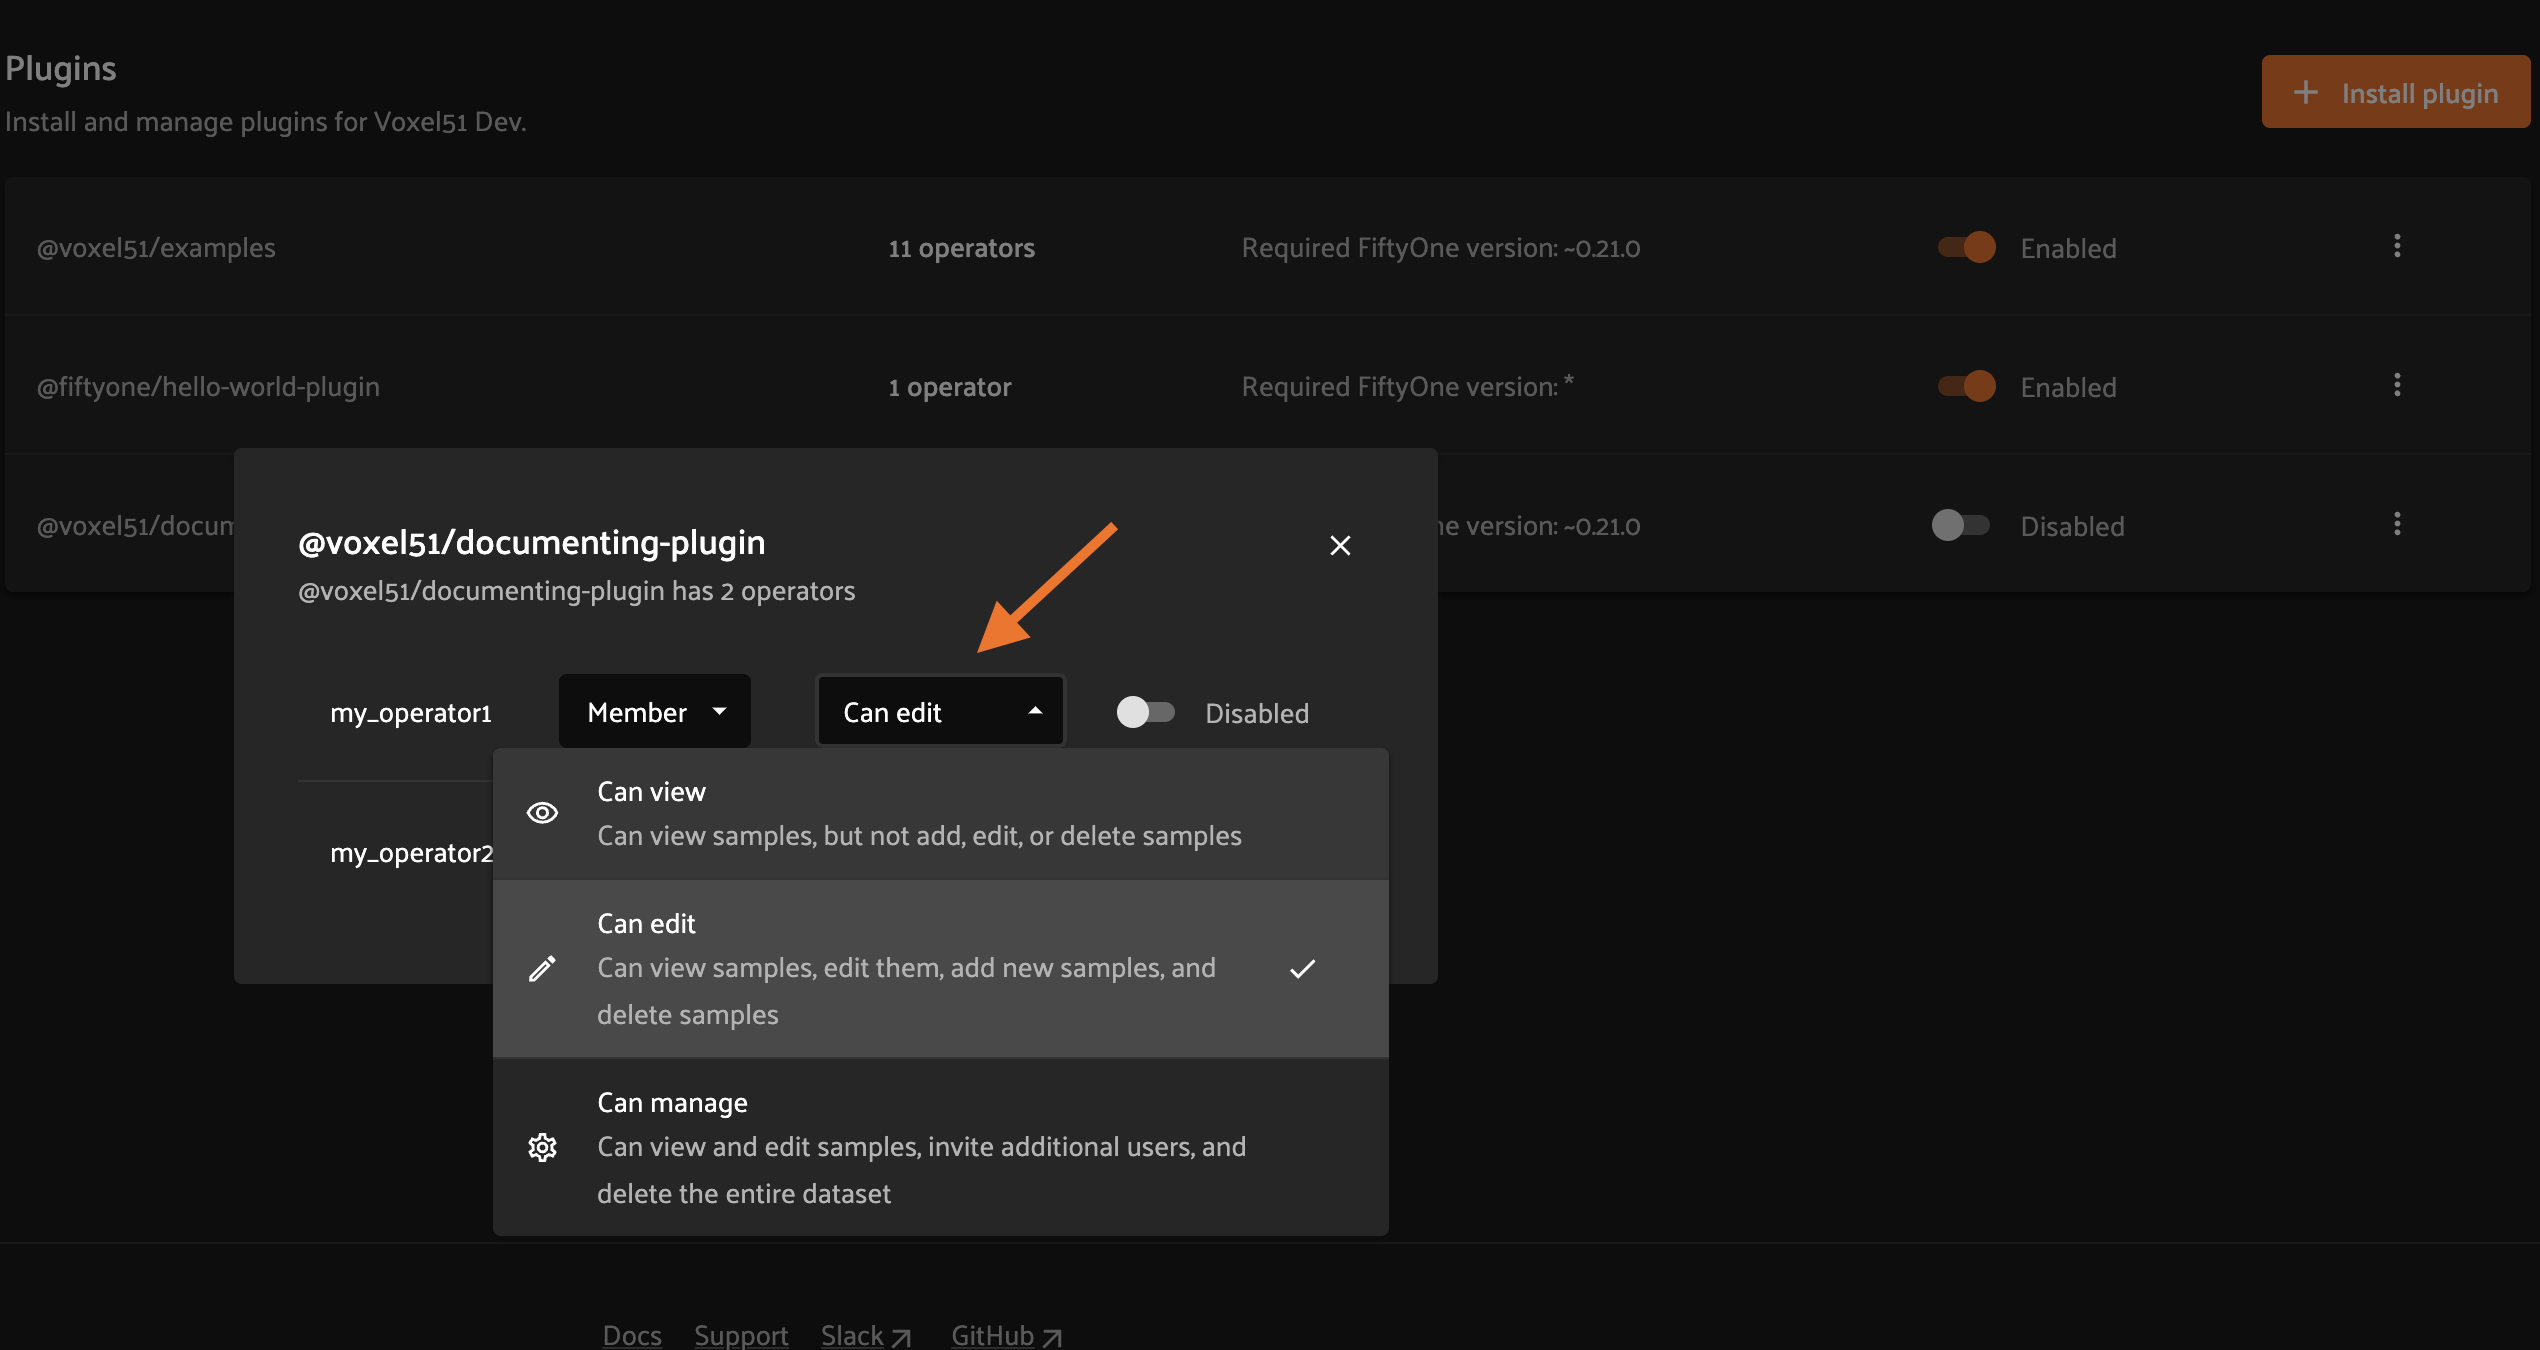
To configure the permissions for an operator, first click on the plugin’s operators link.
Then change the dropdown for the operator to reflect the desired permission level.
SDK#
Admins can also use the
set_plugin_operator_permissions()
method from the Management SDK:
 1import fiftyone.management as fom
 2
 3# Set minimum role permission only
 4fom.set_plugin_operator_enabled(
 5    plugin_name,
 6    operator_name,
 7    minimum_role=fom.MEMBER,
 8)
 9
10# Set minimum dataset permission only
11fom.set_plugin_operator_enabled(
12    plugin_name,
13    operator_name,
14    minimum_dataset_permission=fom.EDIT,
15)
16
17# Set both minimum role and minimum dataset permissions
18fom.set_plugin_operator_enabled(
19    plugin_name,
20    operator_name,
21    minimum_role=fom.EDIT,
22    minimum_dataset_permission=fom.EDIT,
23)
Default permissions#
When new plugins are installed, any operators they contain are initialized with the default permissions for your deployment.
By default, the initial permissions are:
Permission |
Default |
|---|---|
Minimum Role |
Member |
Minimum Dataset Permission |
Edit |
Enterprise UI#
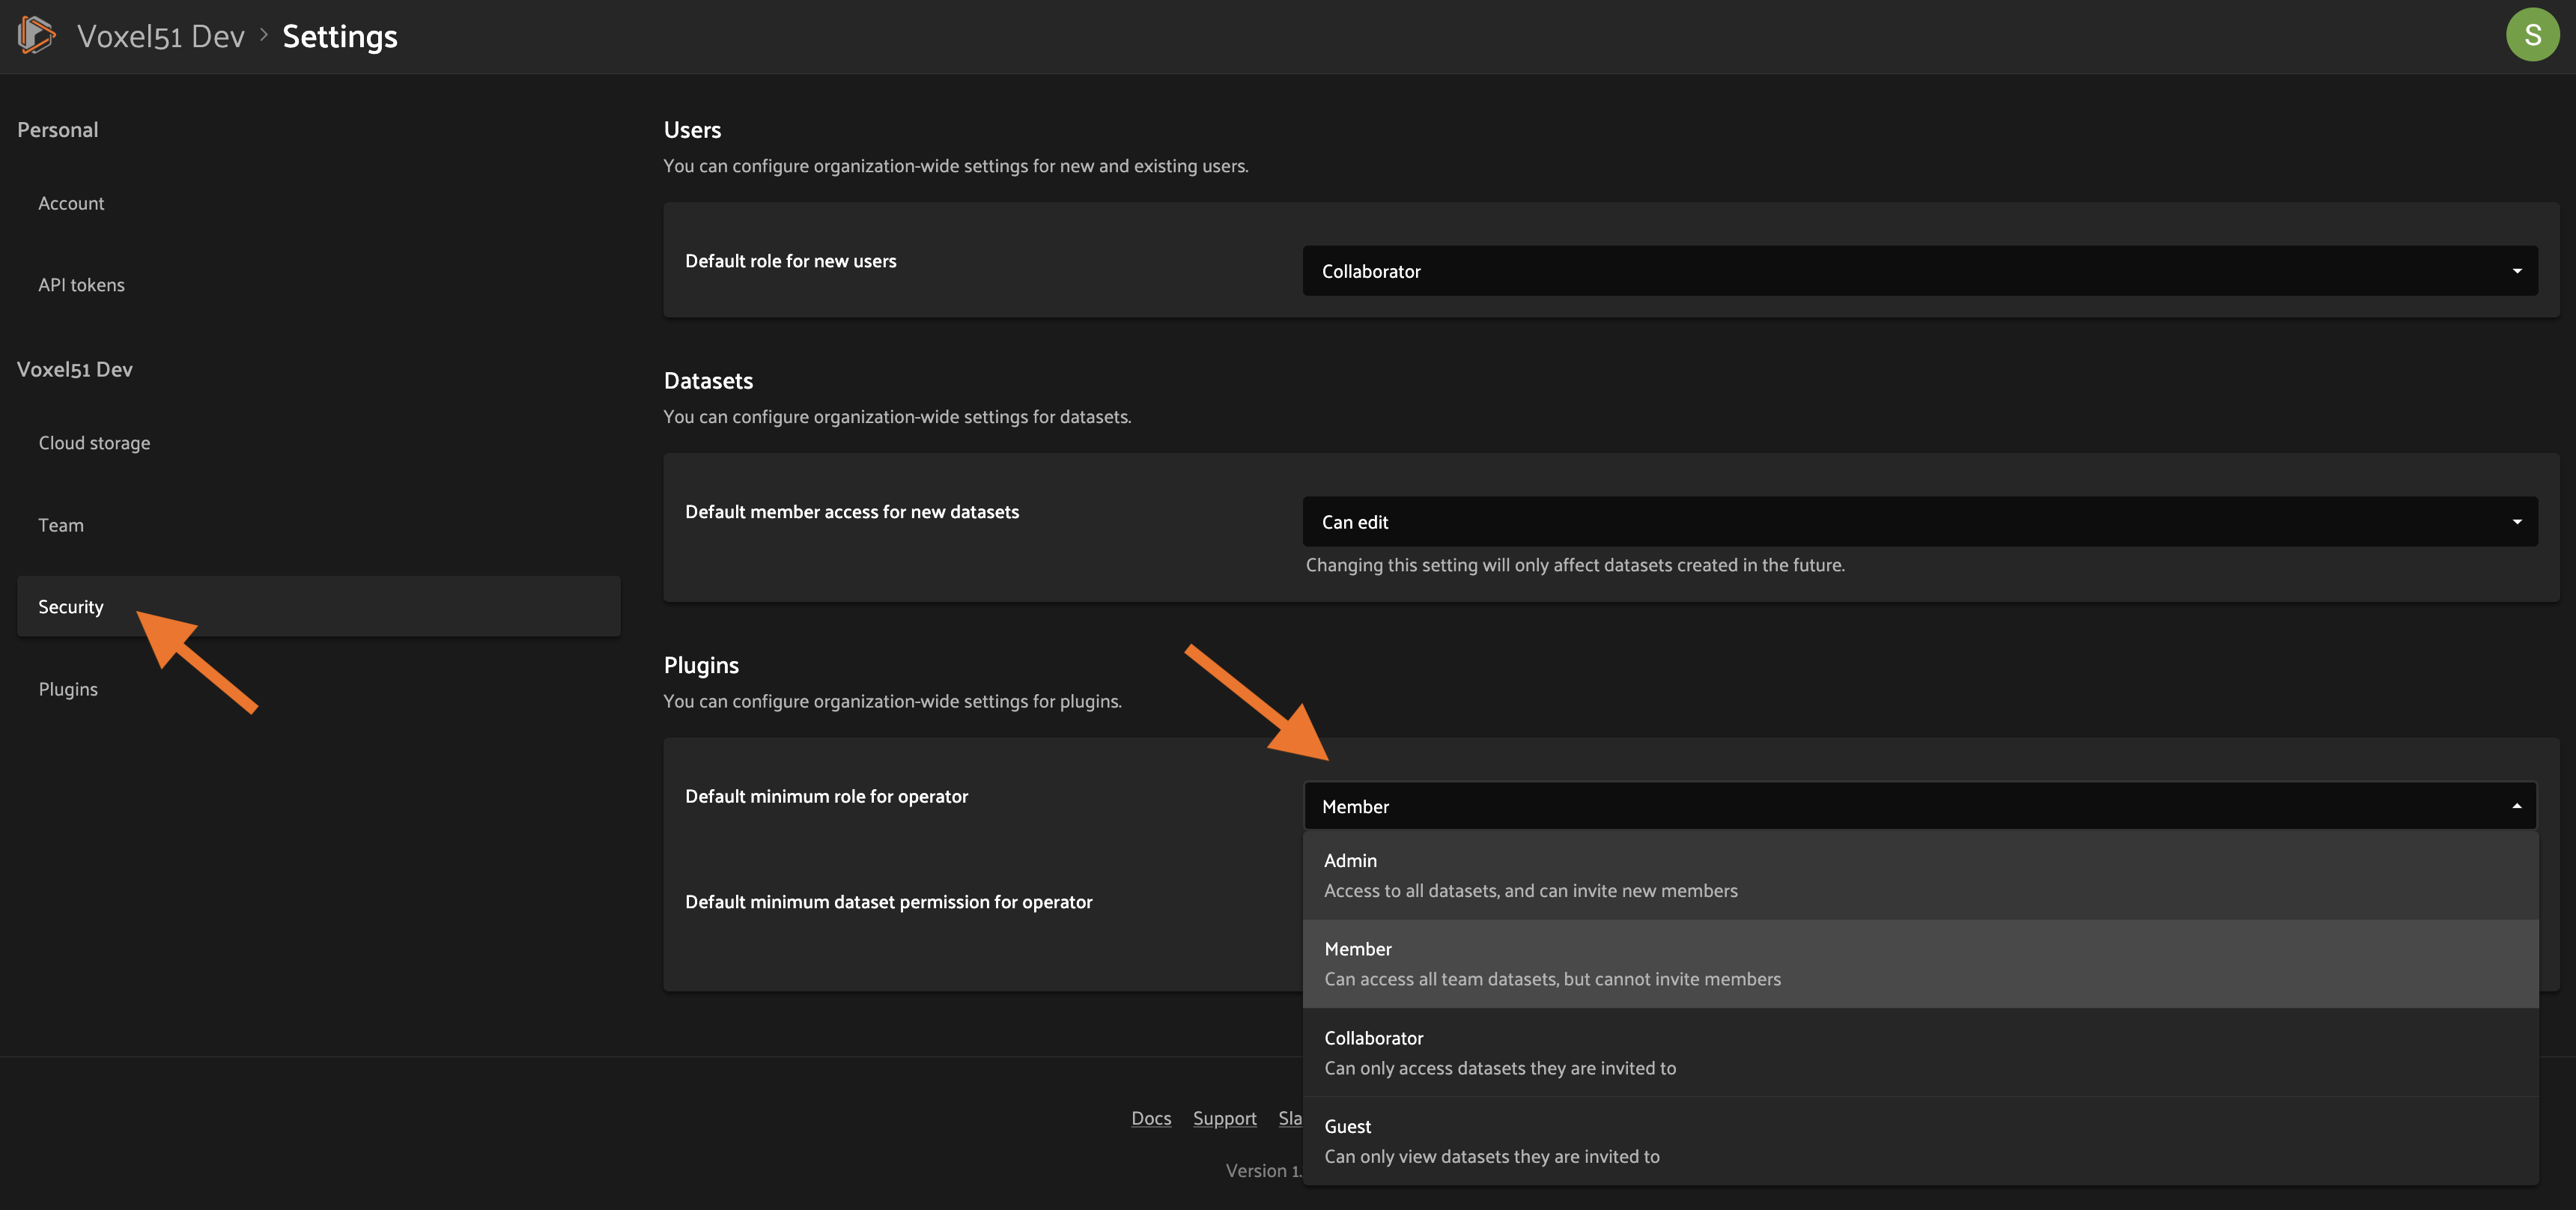
Default operator permissions can be configured by navigating to the page at Settings > Security and looking under the Plugins header. Click the dropdown for the permission you want to change and select the new value.
SDK#
Admins can also use the
set_organization_settings()
method from the Management SDK:
1import fiftyone.management as fom
2
3fom.set_organization_settings(
4    default_operator_minimum_role=fom.MEMBER,
5    default_operator_minimum_dataset_permission=fom.EDIT,
6)
Delegated operations#
Delegated operations are a powerful feature of FiftyOne’s plugin framework that allows users to schedule tasks from within the App that are executed in the background on a connected compute cluster.
With FiftyOne Enterprise, your team can upload and permission custom operations that your users can execute from the Enterprise App, all of which run against a central orchestrator configured by your admins.
Why is this awesome? Your AI stack needs a flexible data-centric component that enables you to organize and compute on your data. With delegated operations, FiftyOne Enterprise becomes both a dataset management/visualization tool and a workflow automation tool that defines how your data-centric workflows like ingestion, curation, and evaluation are performed. In short, think of FiftyOne Enterprise as the single source of truth on which you co-develop your data and models together.
What can delegated operations do for you? Get started by installing any of these plugins available in the FiftyOne Plugins repository:
✏️ Utilities for integrating FiftyOne with annotation tools |
|
🧠 Utilities for working with the FiftyOne Brain |
|
✅ Utilities for evaluating models with FiftyOne |
|
📁 A collection of import/export utilities |
|
📈 Utilities working with FiftyOne database indexes |
|
⚒️ Call your favorite SDK utilities from the App |
|
🤖 An AI assistant that can query visual datasets, search the FiftyOne docs, and answer general computer vision questions |
|
🌎 Download datasets and run inference with models from the FiftyOne Zoo, all without leaving the App |
For example, wish you could import data from within the App? With the @voxel51/io, plugin you can!
Want to send data for annotation from within the App? Sure thing, just install the @voxel51/annotation plugin:
Have model predictions on your dataset that you want to evaluate? The @voxel51/evaluation plugin makes it easy:
Need to compute embedding for your dataset so you can visualize them in the Embeddings panel? Kick off the task with the @voxel51/brain plugin and proceed with other work while the execution happens in the background:
When you choose delegated execution in the App, these tasks are automatically scheduled for execution on your connected orchestrator and you can continue with other work. Meanwhile, all datasets have a Runs tab in the App where you can browse a history of all delegated operations that have been run on the dataset and their status.
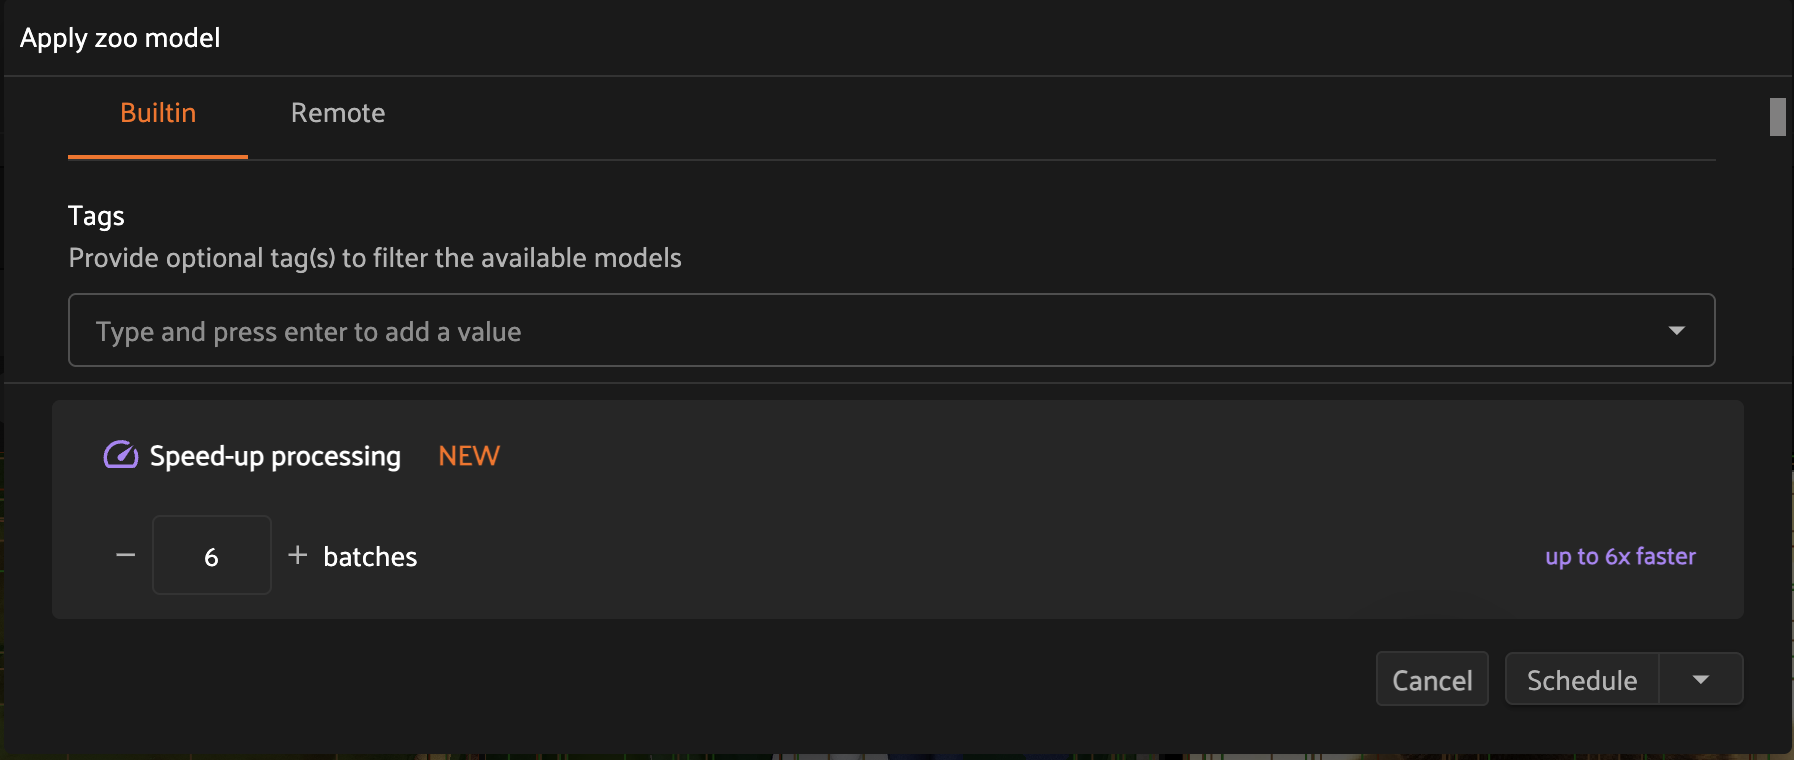
Distributed execution NEW#
Added in version 2.11.0.
FiftyOne Enterprise supports distributed execution of delegated operations across many workers in parallel.
When you schedule a distributable operation from the App, you can choose how many batches to split the operation into. The dataset or target view will be split up into that number of tasks, and each task will be executed independently on a separate worker, allowing you to scale out the execution of large operations across many machines.
If you choose a number of tasks (T) less than the deployment’s maximum, the operation can complete up to T times faster, if resources are available and tasks are balanced!
Note
Follow these simple instructions to update your operators to support distributed execution.
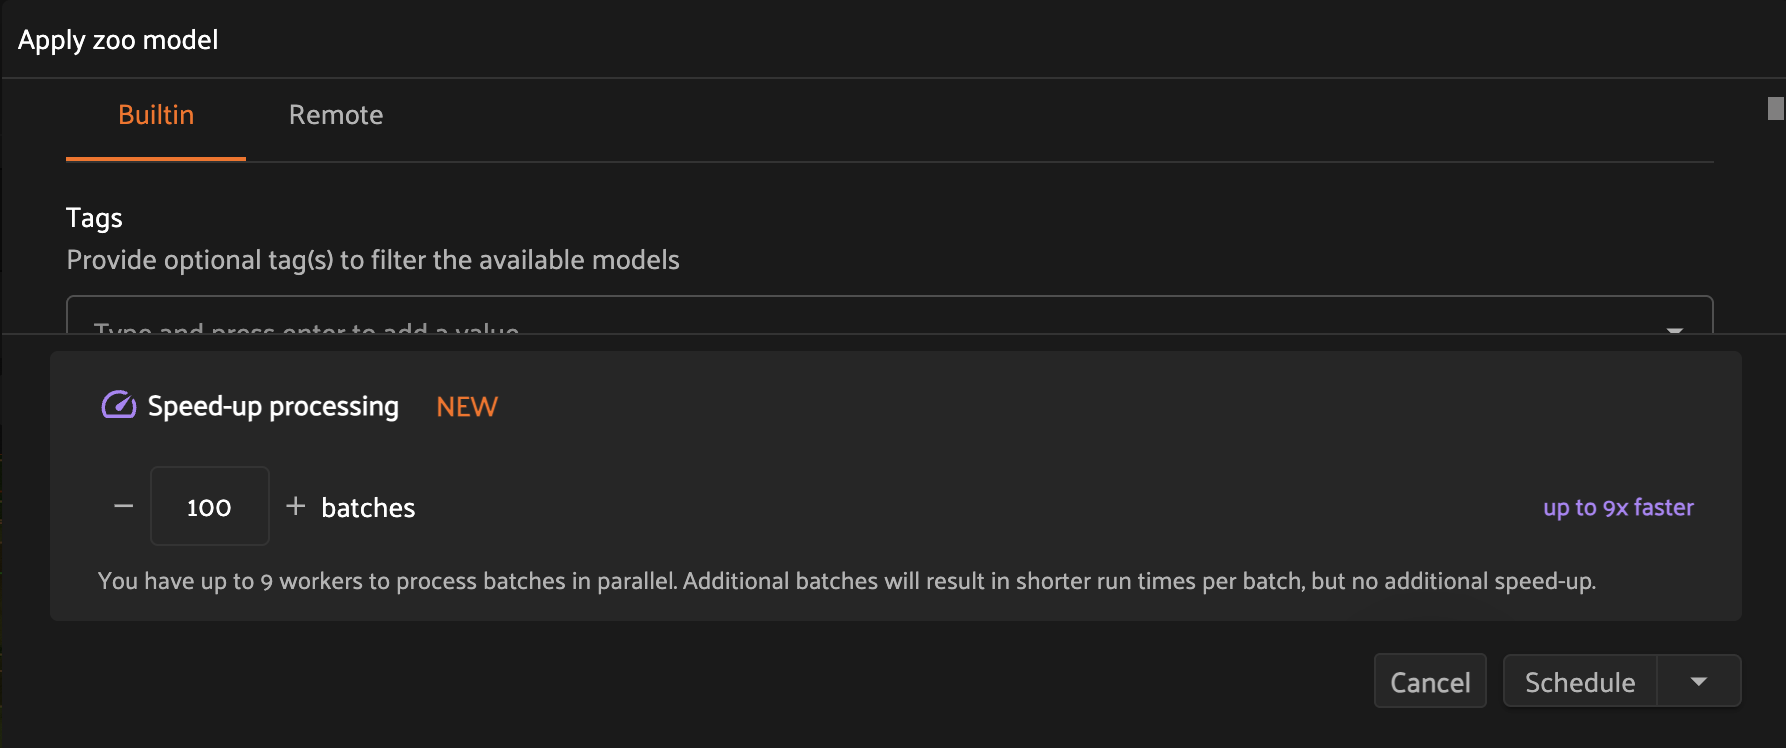
You may want to split an operation into more tasks than can be run concurrently based on your deployment’s maximum. For example, you may do this to limit the runtime of each individual task so that the scheduling engine can prioritize other tasks as necessary throughout execution.
In the example below, we have chosen to split a distributable operation into 100 batches, but the deployment maximum is 9 concurrent tasks, so at most 9 batches will be processed in parallel at any given time.
Once scheduled, you can monitor the status of a distributed operation, including fine-grained details about each individual worker, from the Runs page.
Note
Contact your Voxel51 support team to increase your deployment’s maximum delegated operation capacity.
Configuring your orchestrator(s)#
FiftyOne Enterprise offers a builtin orchestrator that is configured as part of your team’s deployment with a default level of compute capacity.
As you scale your usage of FiftyOne, you’ll likely want to scale your deployment’s compute capacity and take advantage of advanced features such as configuring an on-demand compute integration with your external compute platform such as Databricks or Anyscale.
Note
Contact your Voxel51 support team to scale your deployment’s compute capacity, for more information about on-demand compute integrations, or if you’d like to use another external orchestrator.
On-demand compute NEW#
Added in version 2.11.0.
Note
On-demand compute is currently in beta and its API or functionality may change in future releases.
FiftyOne Enterprise supports executing delegated operations on-demand in your connected external compute platform. With on-demand compute, resources are only provisioned and used when they’re actually needed, minimizing idle times.
On-demand compute is currently supported on FiftyOne’s Kubernetes Orchestrator, Databricks, and Anyscale.
Administrators can refer to the deployment guide to learn how to configure on-demand compute for their FiftyOne Enterprise deployment.
External orchestrators#
It is also possible to connect your FiftyOne Enterprise deployment to other externally-managed workflow orchestration tools, such as Airflow, Flyte, and Spark. Please contact your Voxel51 support team for further details.
Managing delegated operations#
Every dataset in FiftyOne Enterprise has a Runs page that allows users with access to monitor and explore delegated operations scheduled against that dataset.
All scheduled operations are maintained in a queue and will be automatically executed as resources are available on the targeted orchestrator.
Note
The Runs page only tracks operations that are scheduled for delegated execution, not operations that are executed immediately in the App.
Runs page#
All users with at least Can View access to a dataset can visit the Runs page by clicking on the “Runs” tab.
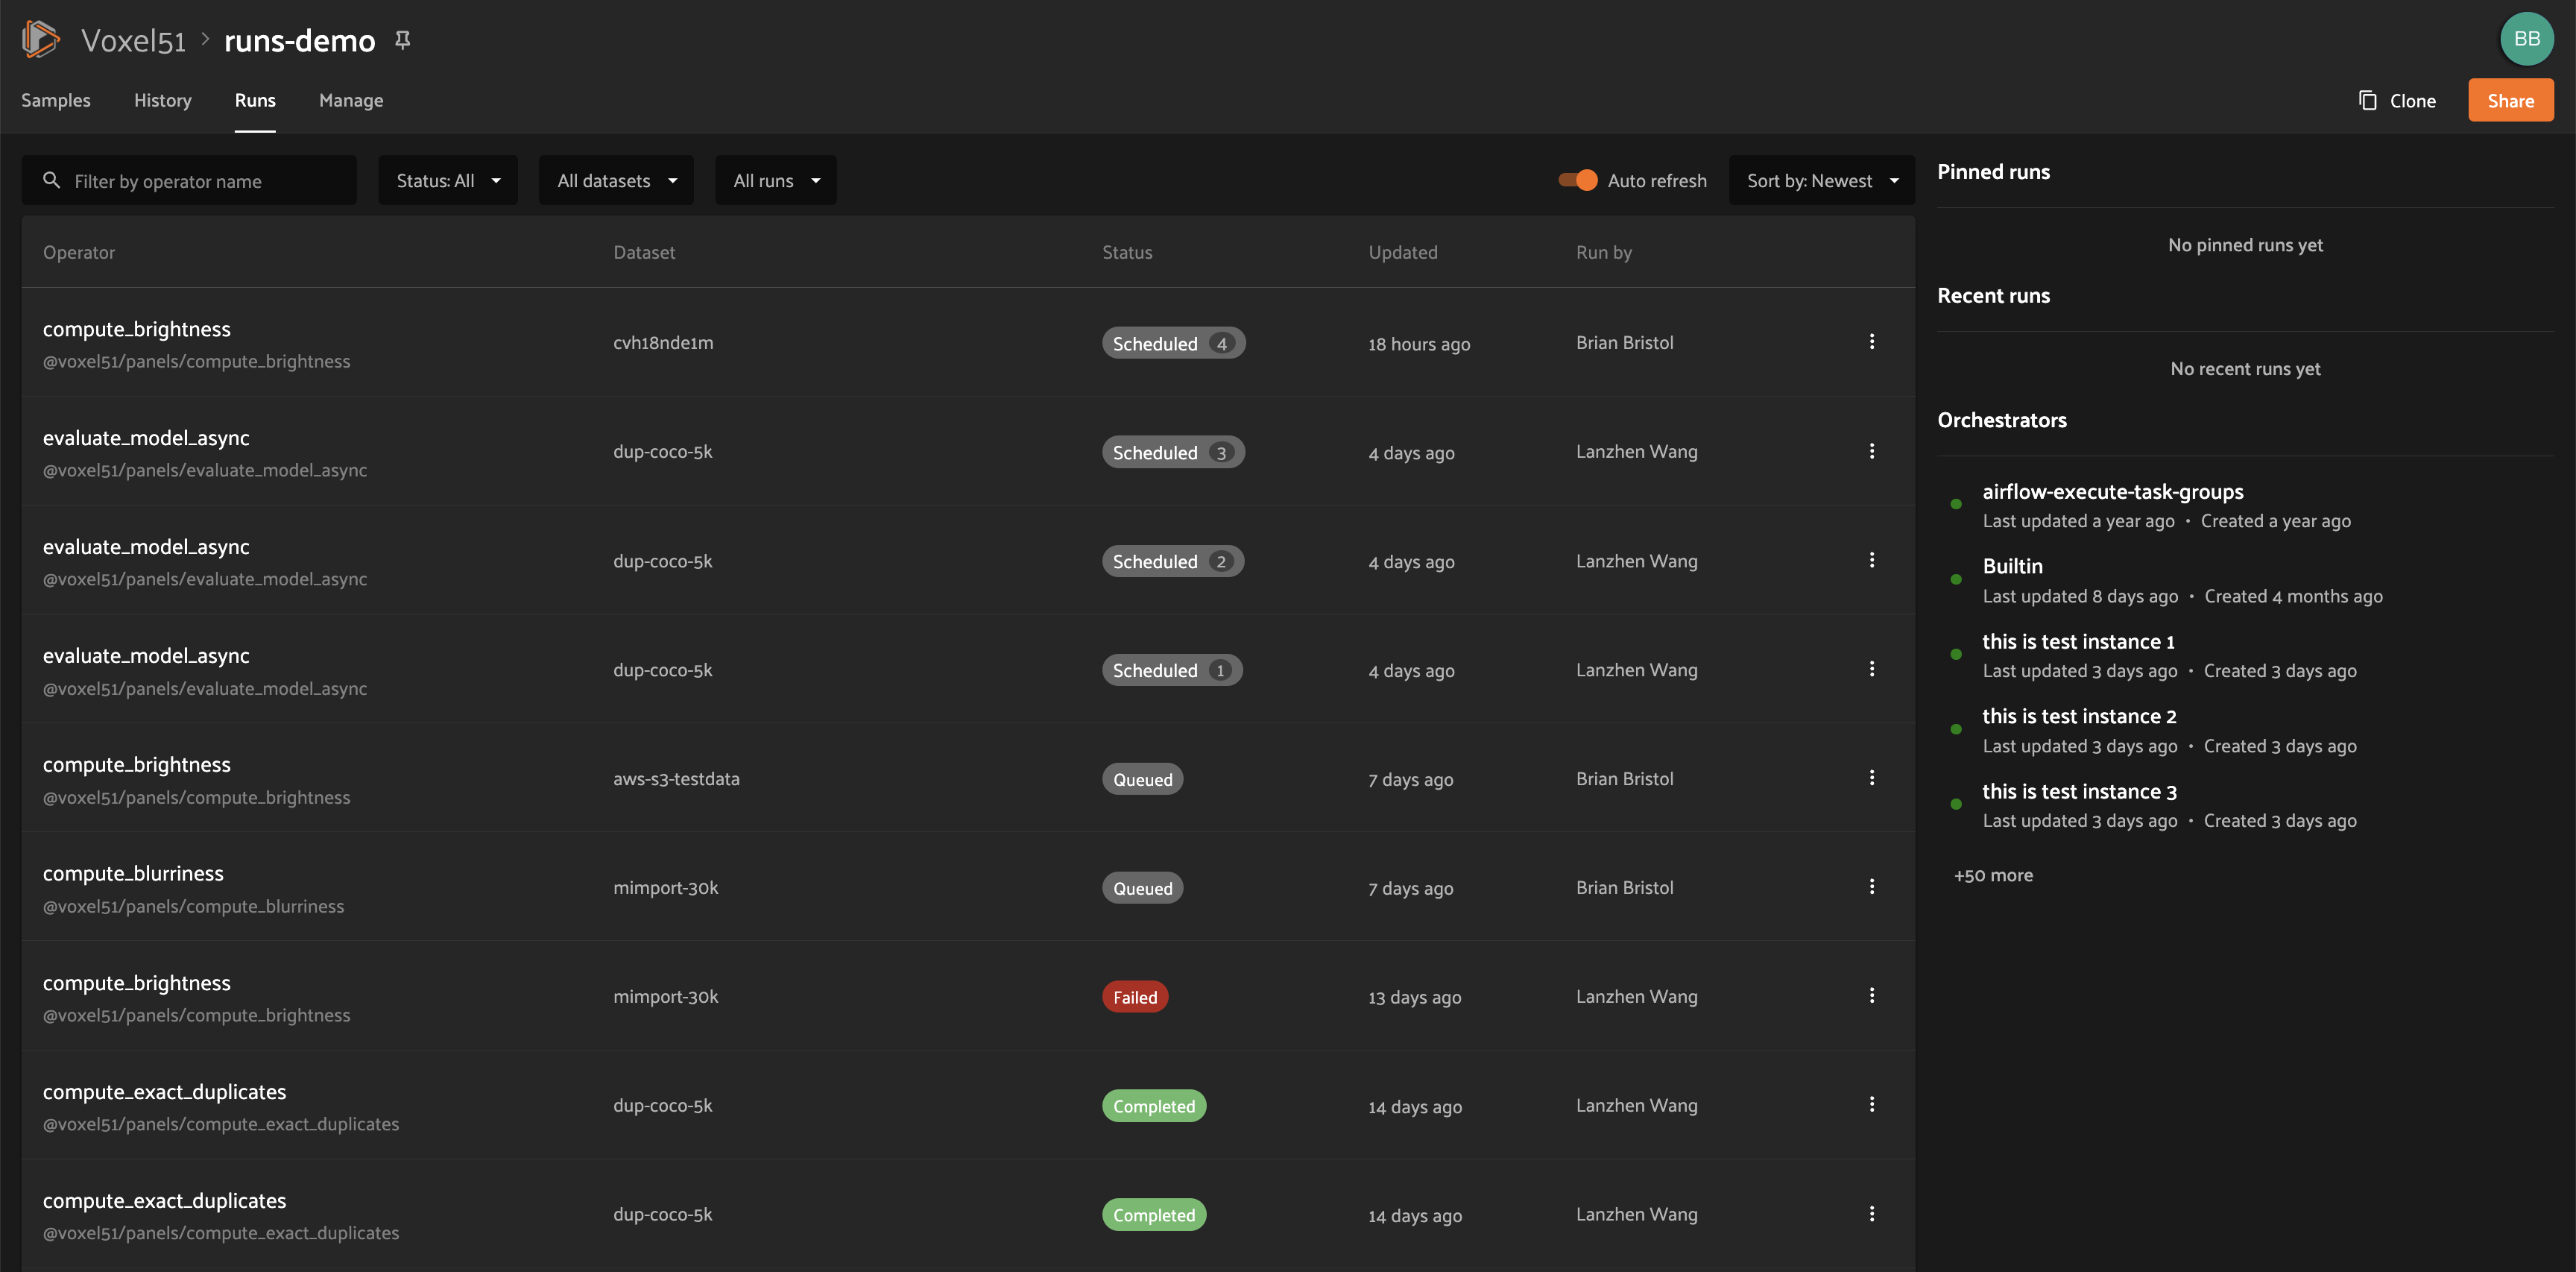
On the Runs page, you will see a table with a list of delegated operations. Admins can choose whether to view operations for all datasets or only the current dataset, while non-admins can only view operations associated with the current dataset.
The table provides options to sort, search, and filter runs shown to refine the list as you like:
Statuses#
Delegated operations can have one of 5 potential statuses:
Scheduled: the run has been scheduled for execution and is awaiting execution quota. All delegated operations begin life in this state
Queued: the run has been allocated execution quota and it will start running as soon as orchestrator resources become available
Running: the run is currently being executed
Completed: the run has completed successfully
Failed: the run failed to complete
Note
Distributed operations have a computed status based on the statuses of their individual tasks. For example, a distributed operation is considered “Completed” only when all of its tasks have completed successfully.
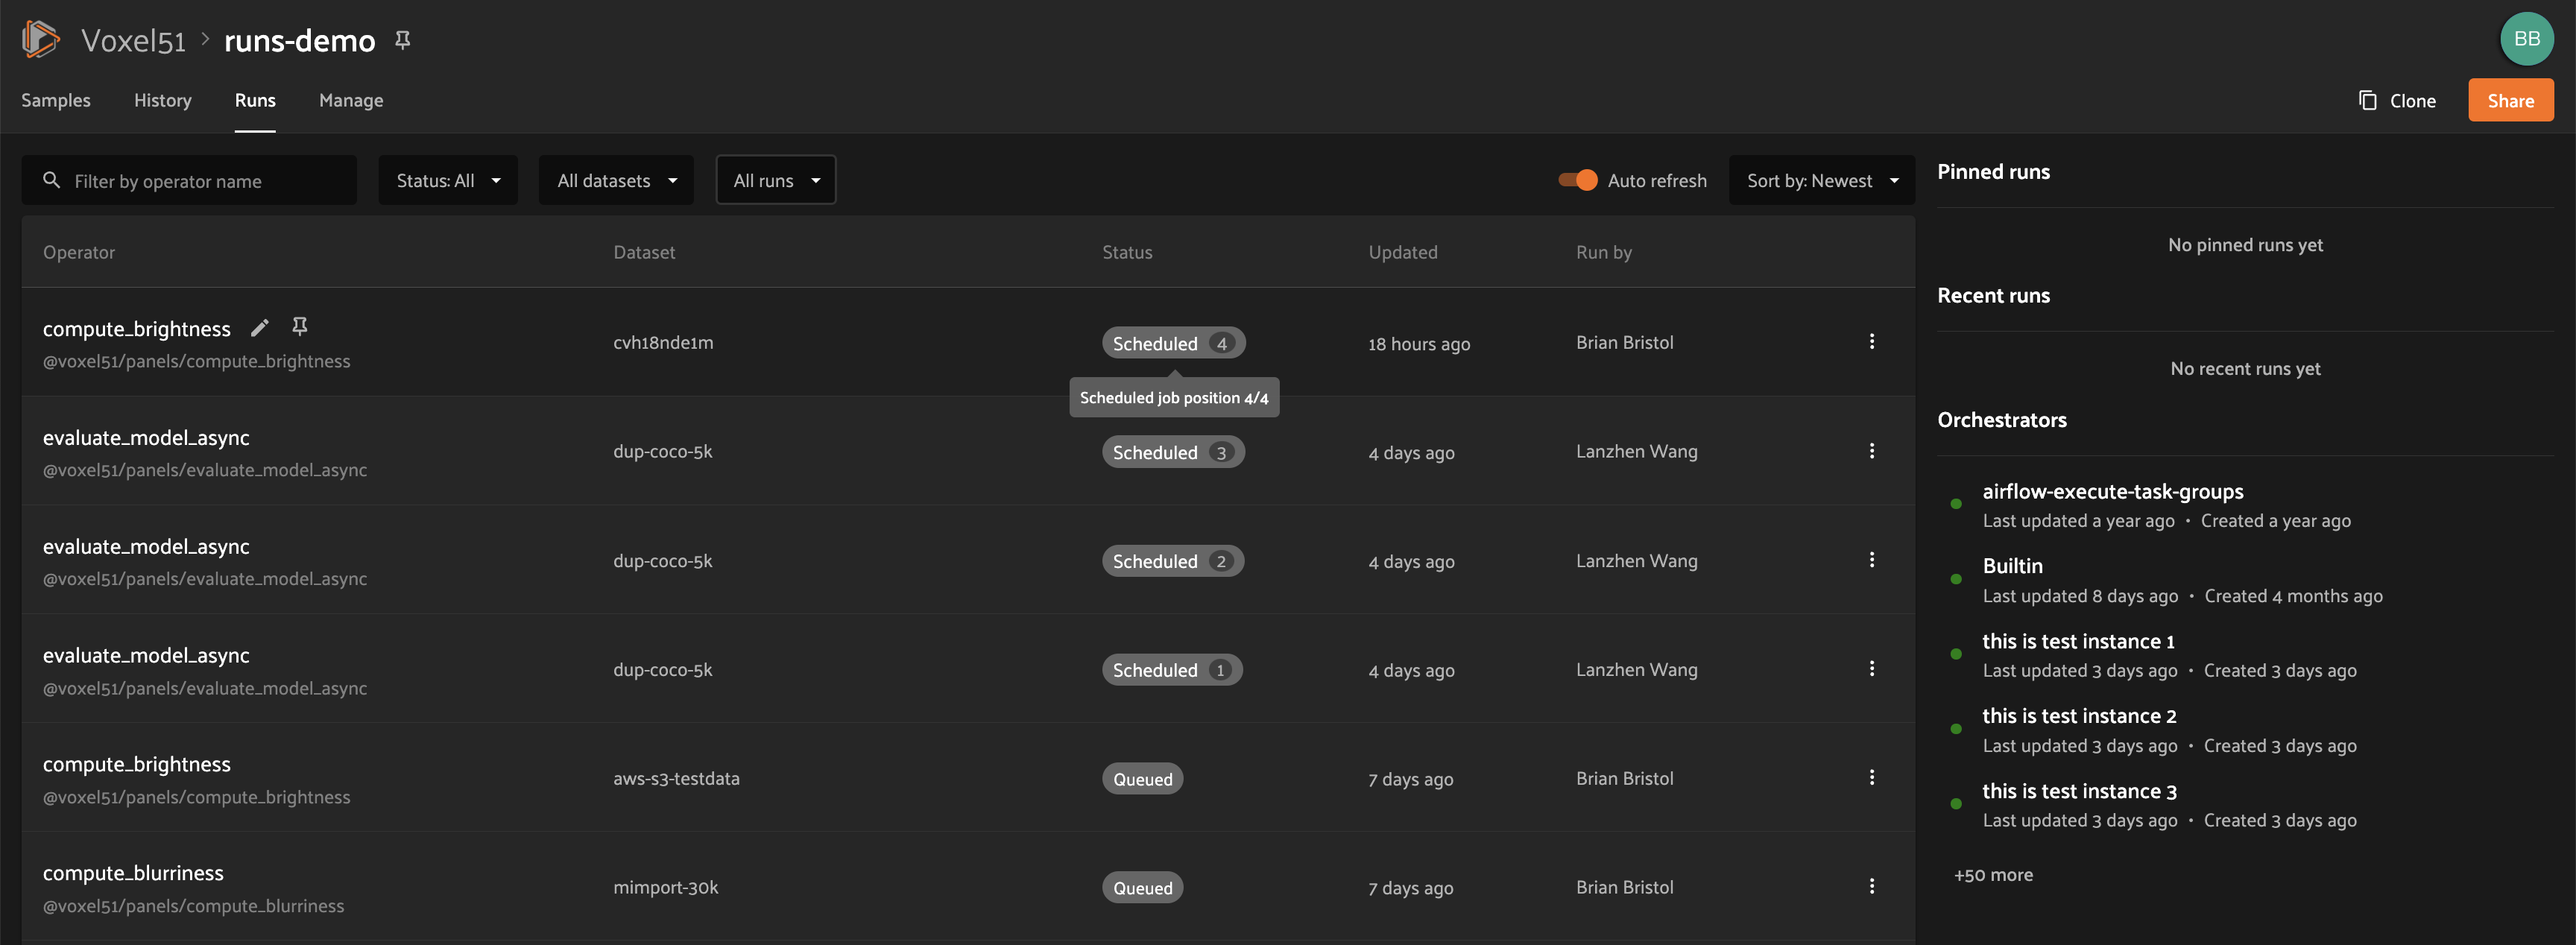
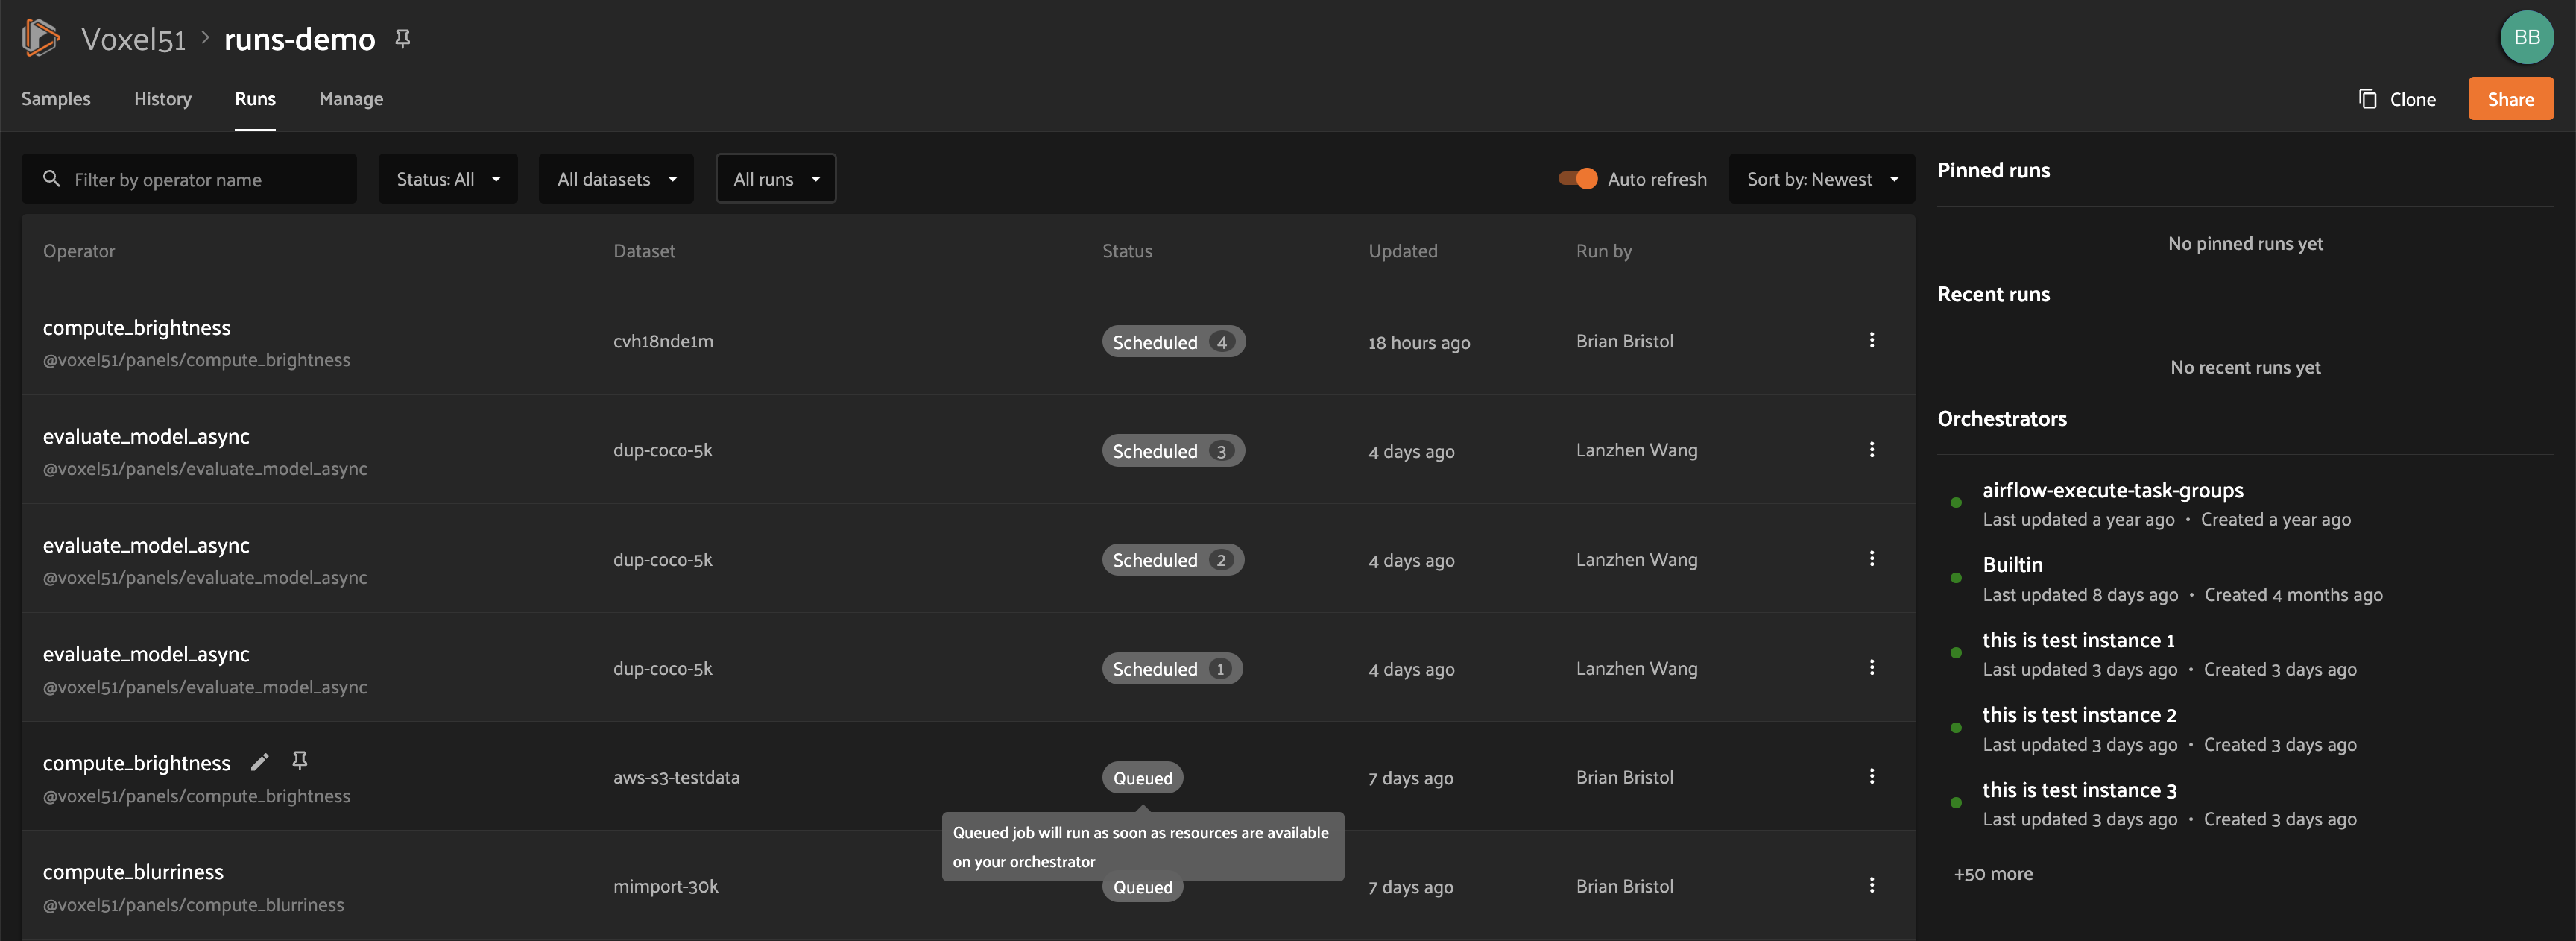
You can hover over the status badge of a run in Scheduled or Queued state to see additional information about its execution, including its position in the Scheduled queue:
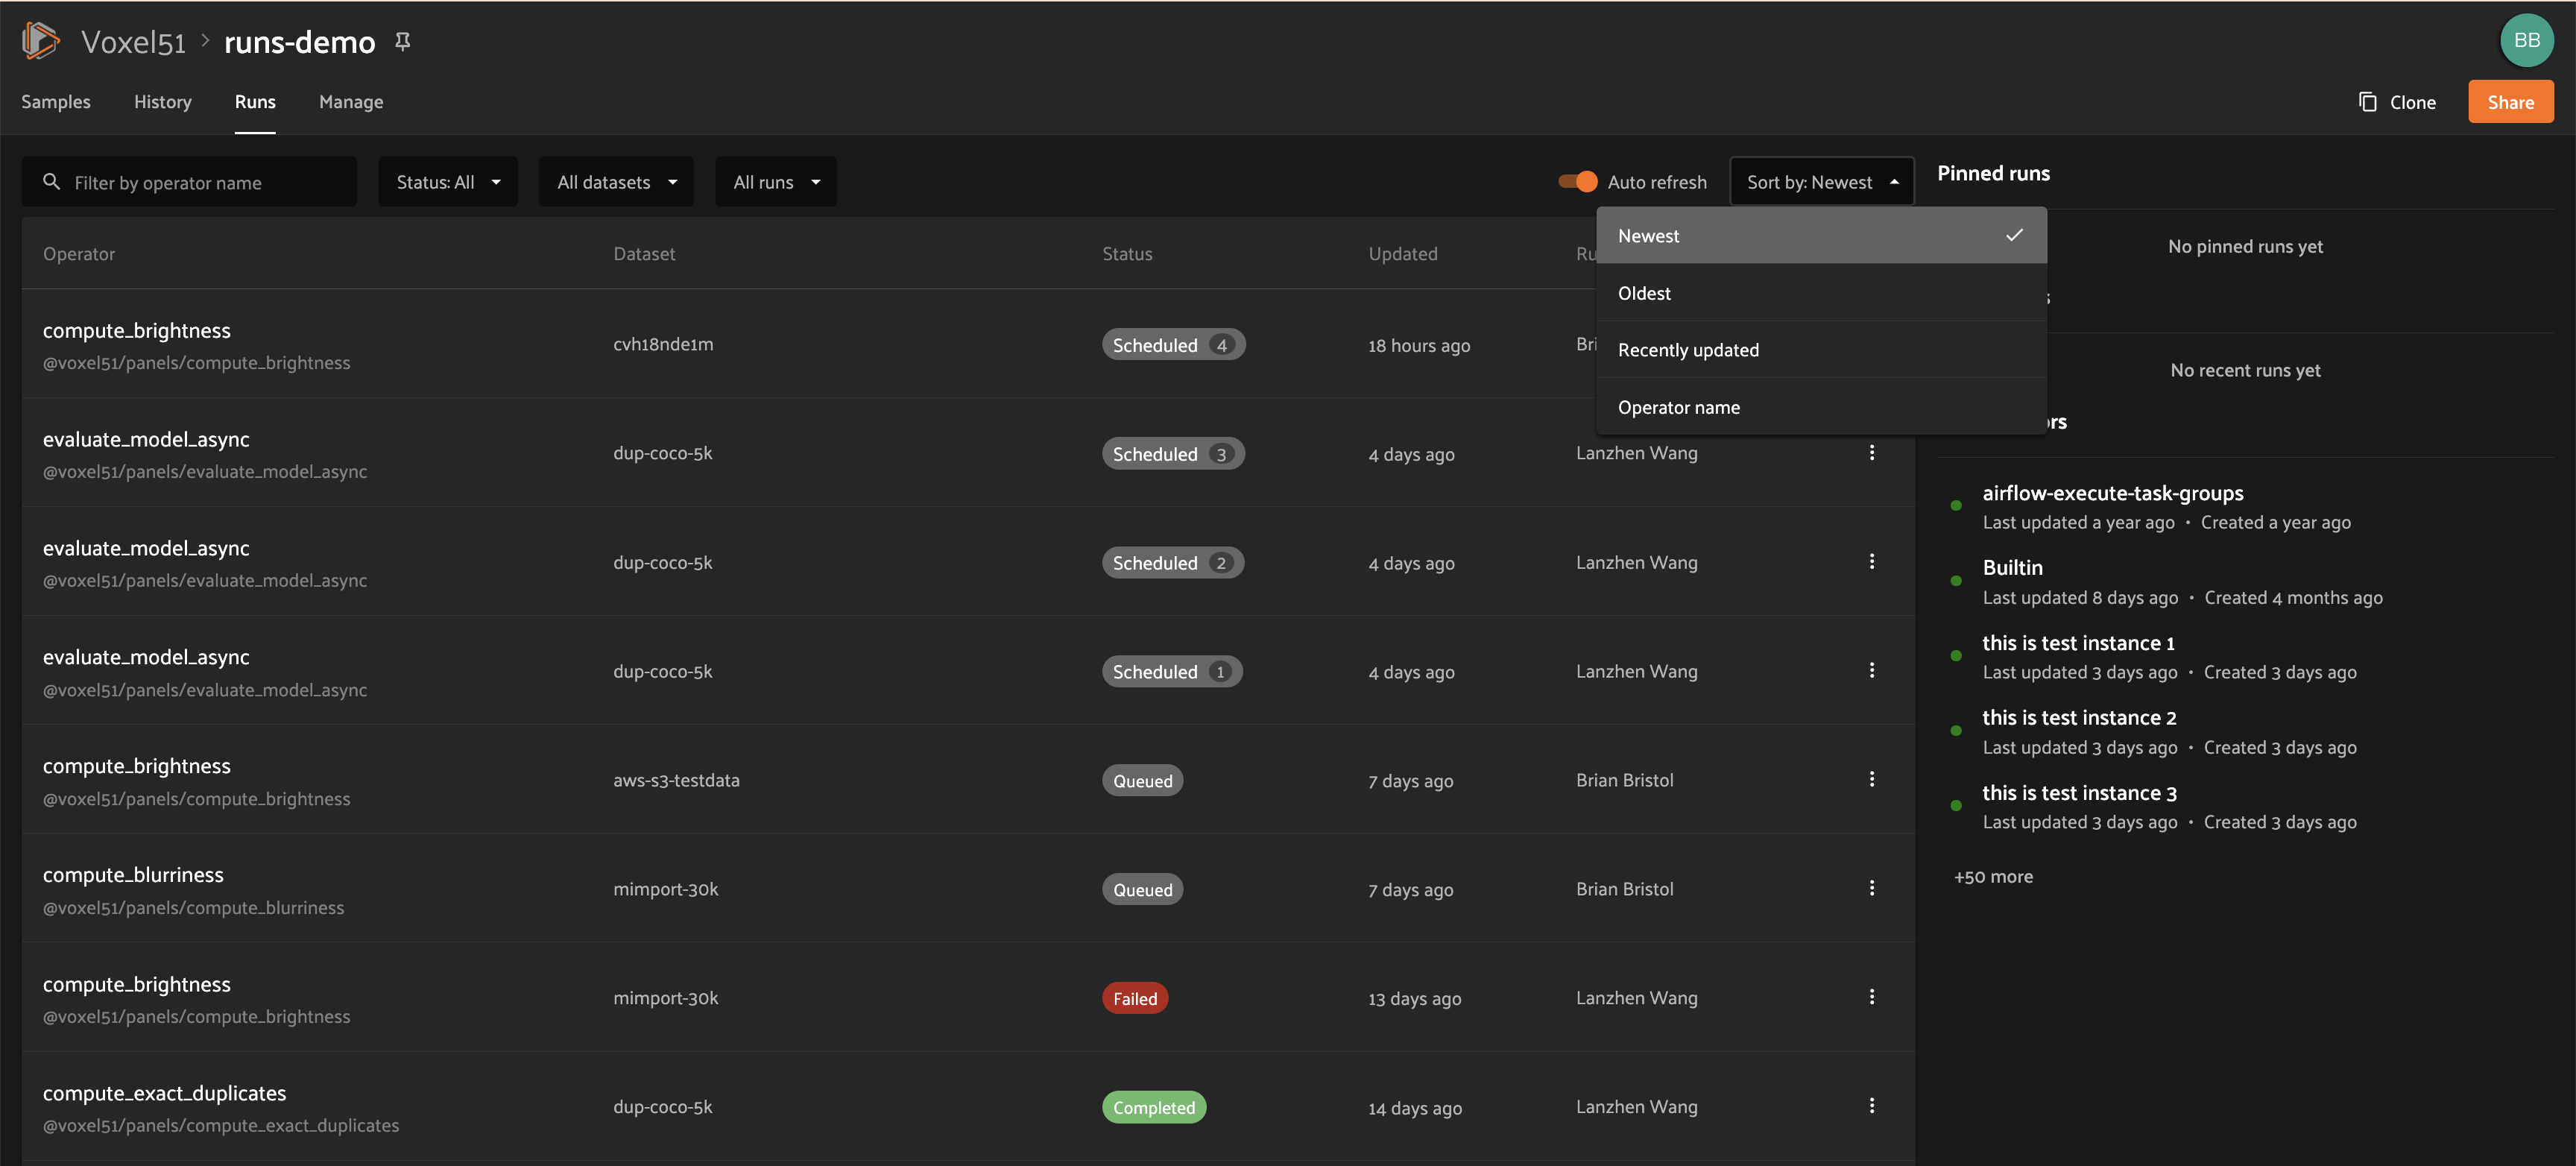
Sorting#
By default, the runs table is sorted by recency, with the most recently scheduled run at the top. You can use the dropdown menu in the upper right of the table to sort by other criteria, including last updated, oldest, or operator name:
Filtering#
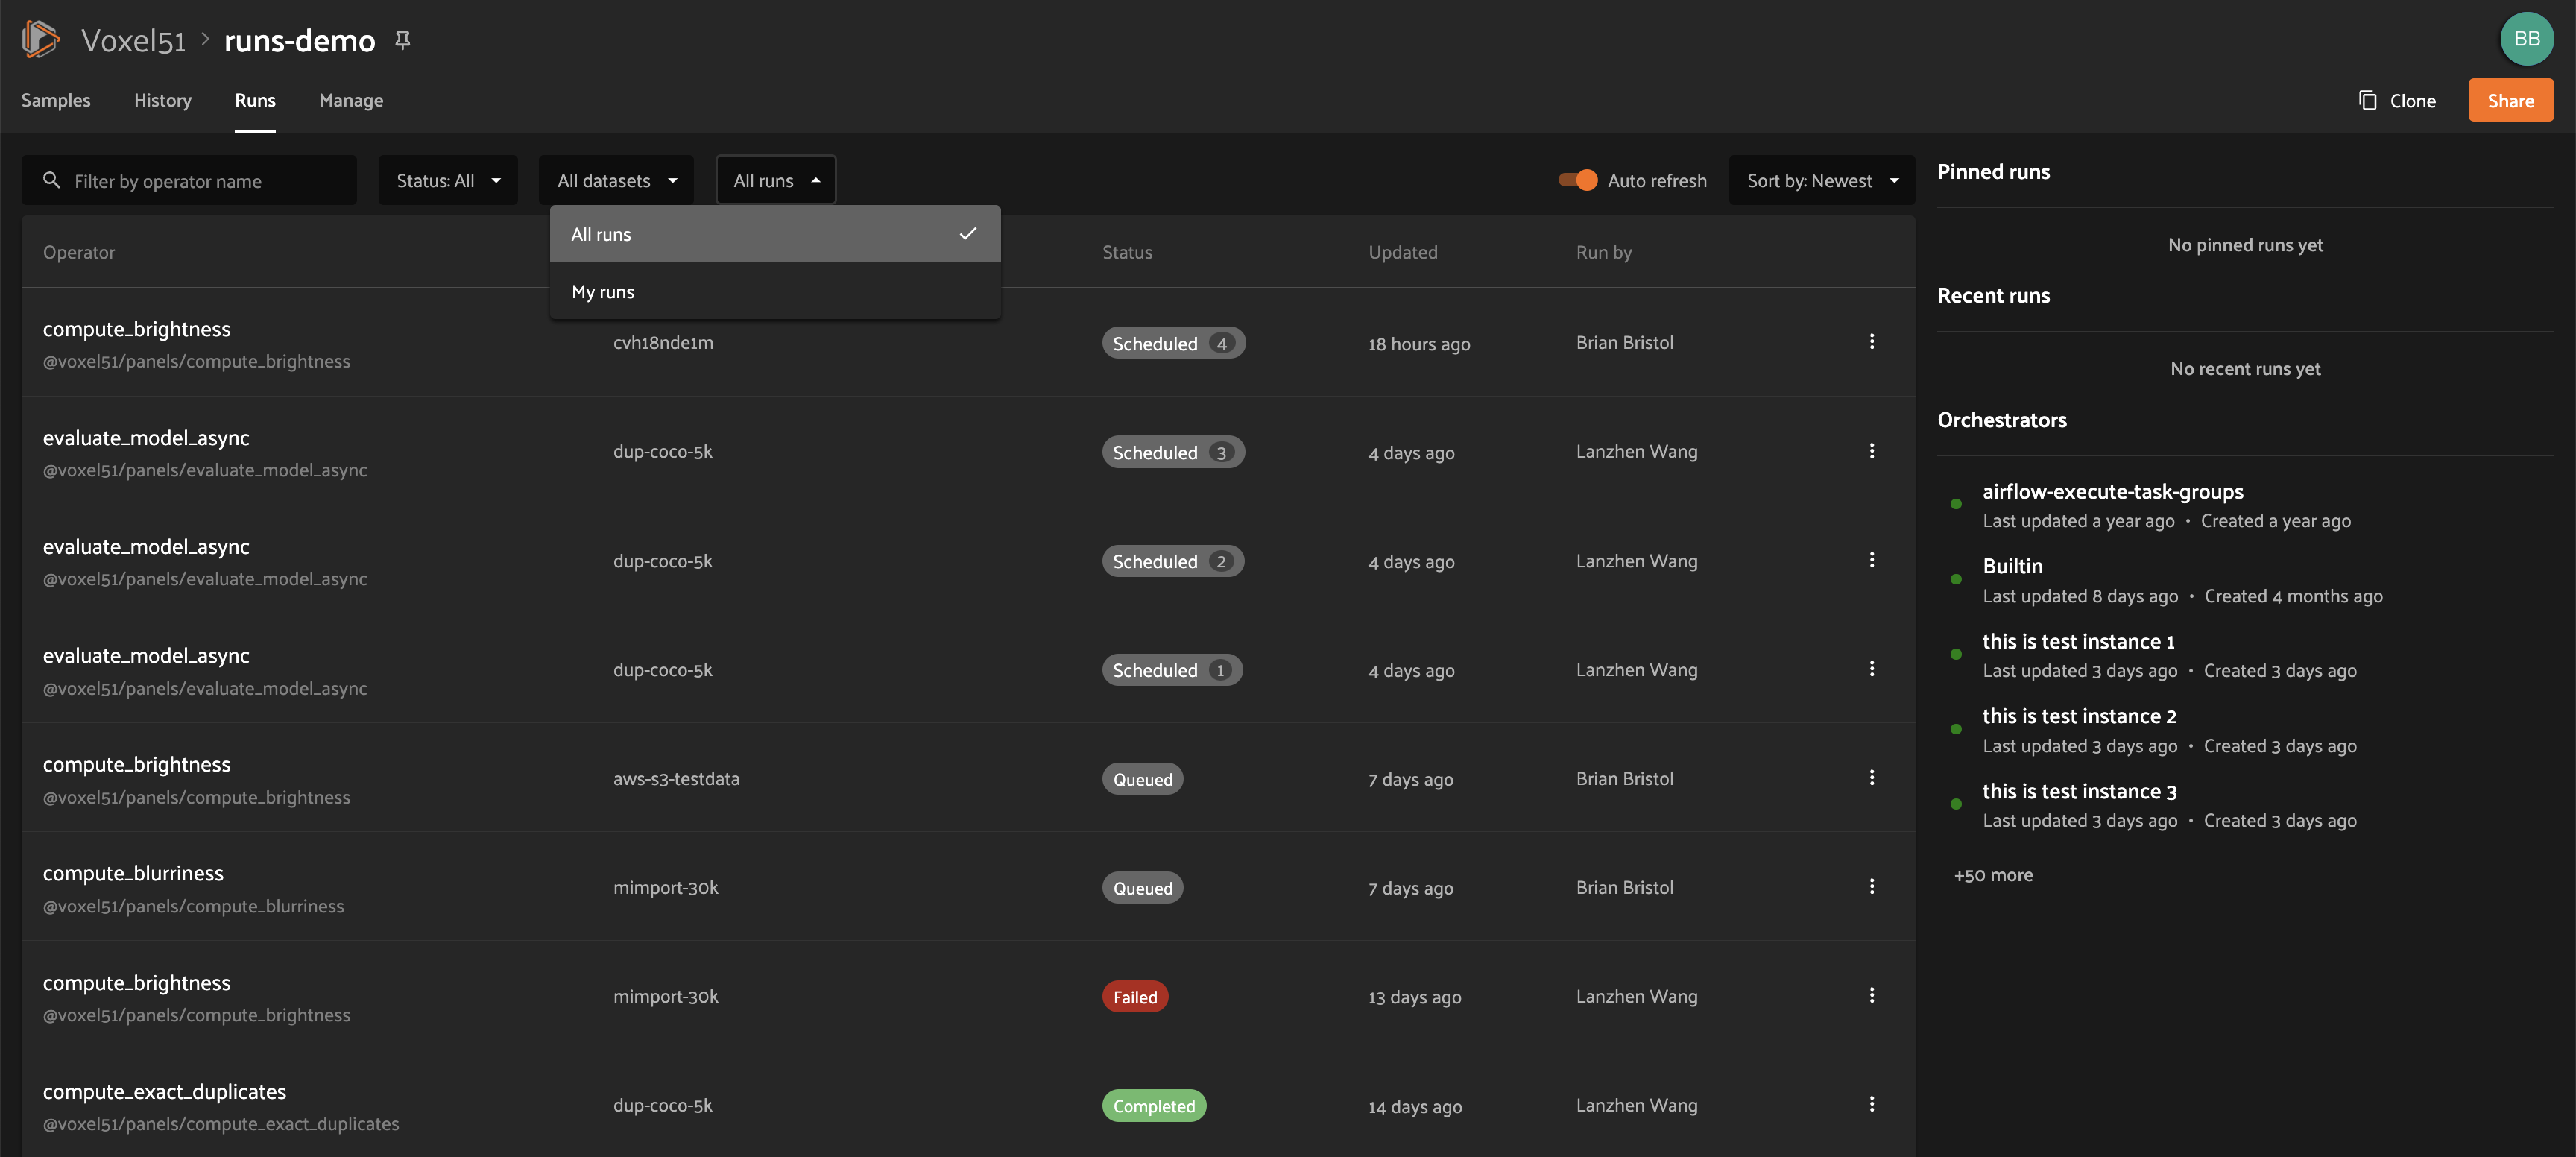
You can also filter the runs table to see a subset of runs.
Users with sufficient privileges can toggle between “My Runs” and “All Runs” to see runs you have scheduled versus runs that others in your organization have scheduled on the current dataset:
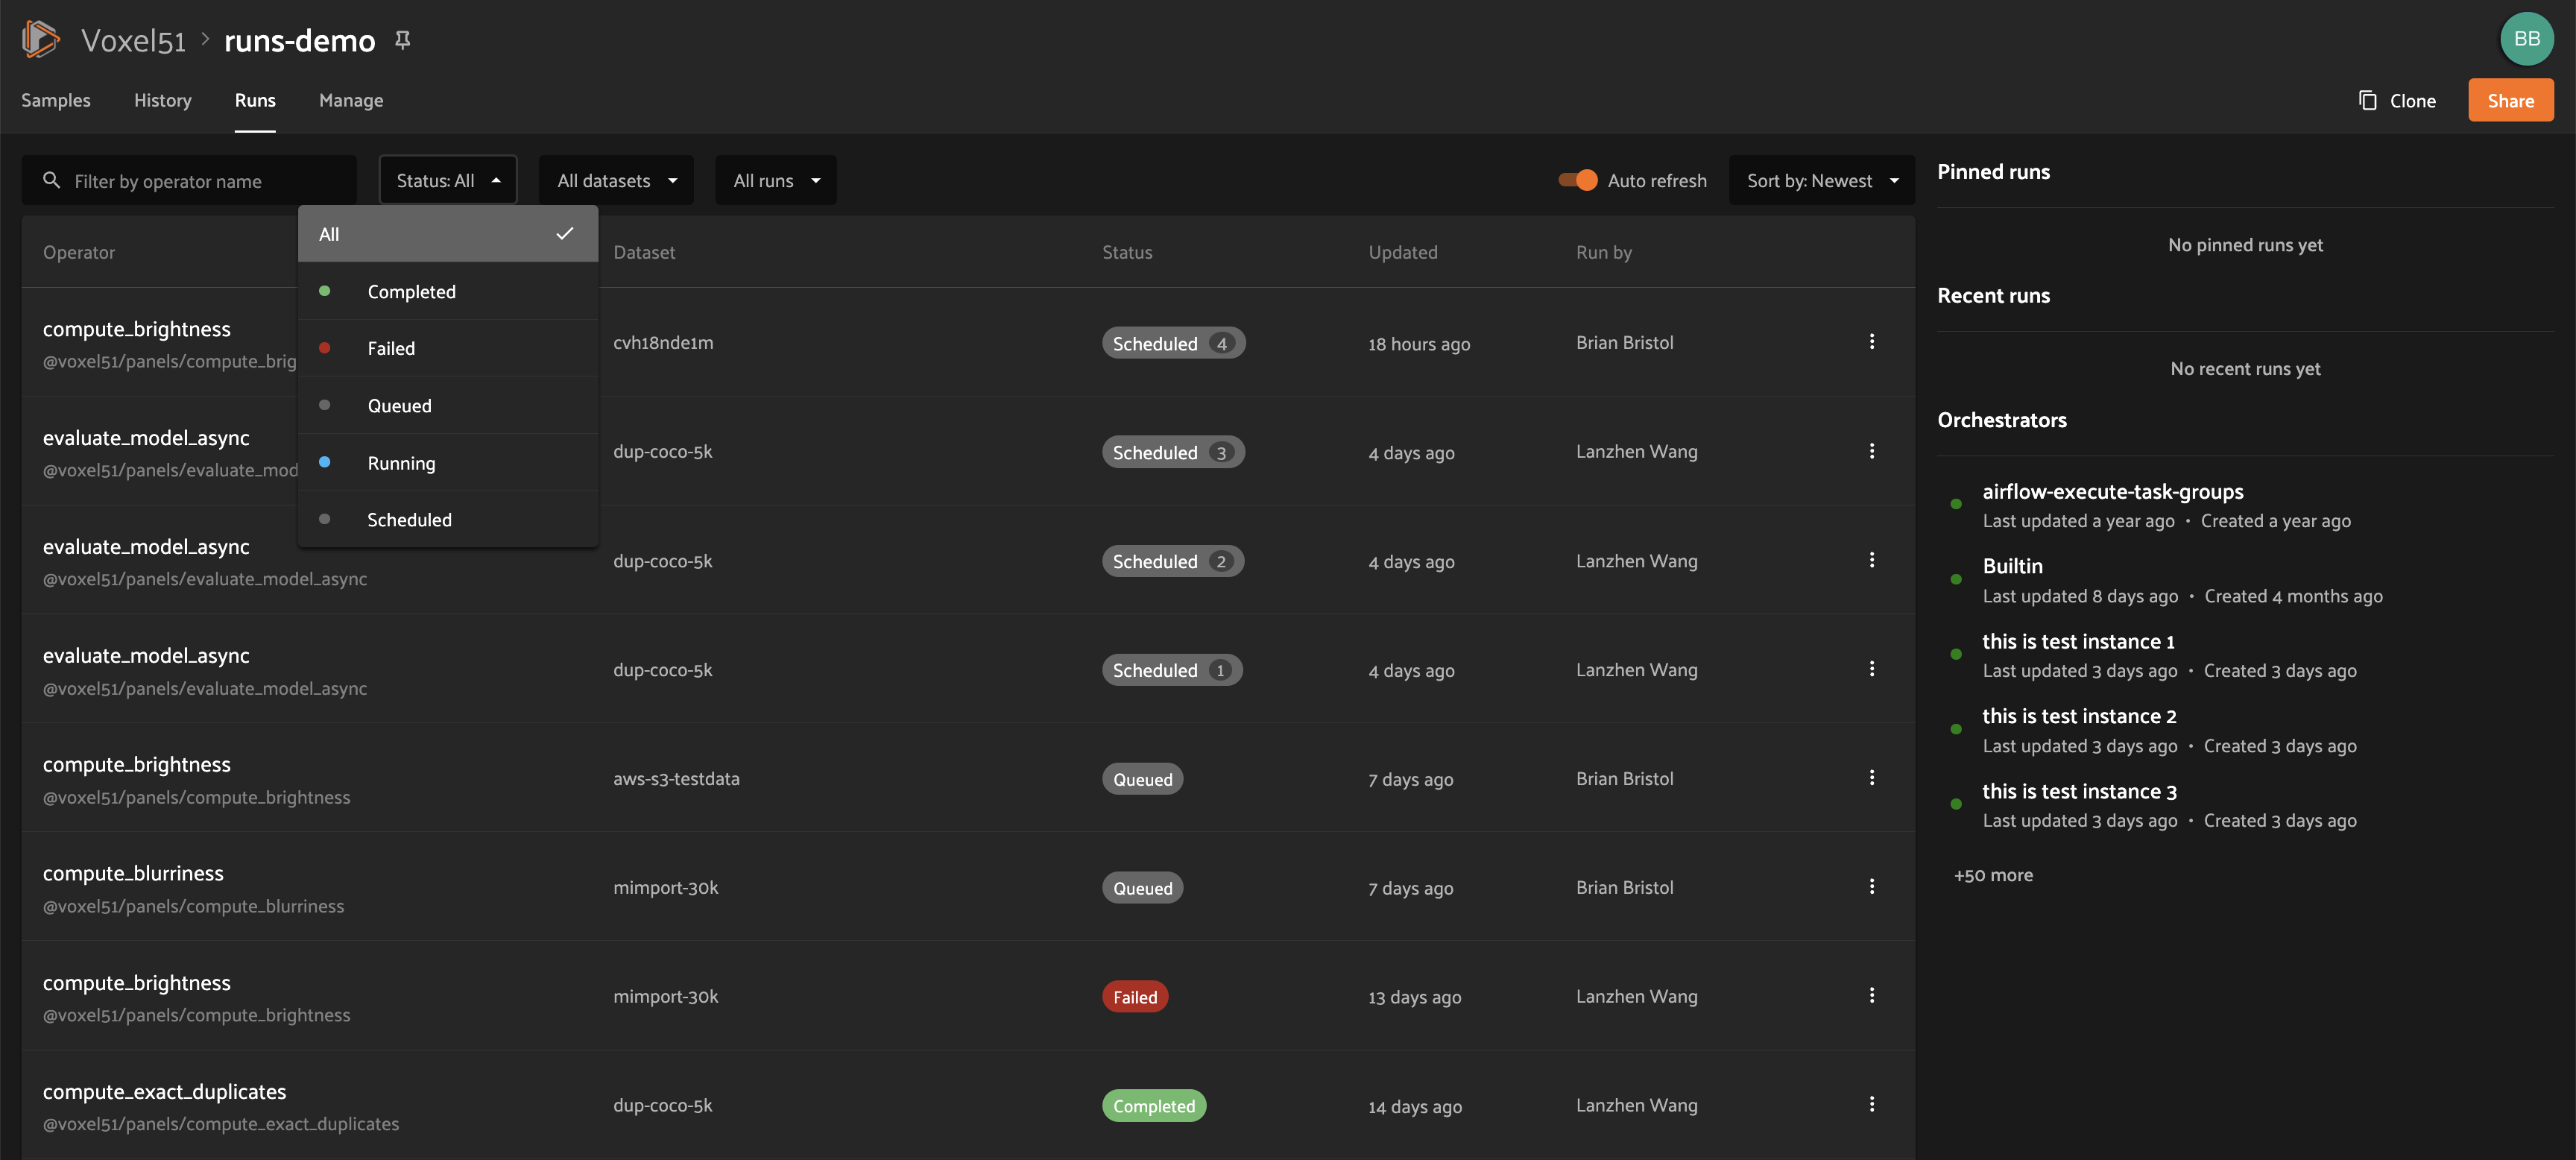
All users can further refine the list of runs using the Status dropdown to select one or more statuses you would like to filter by:
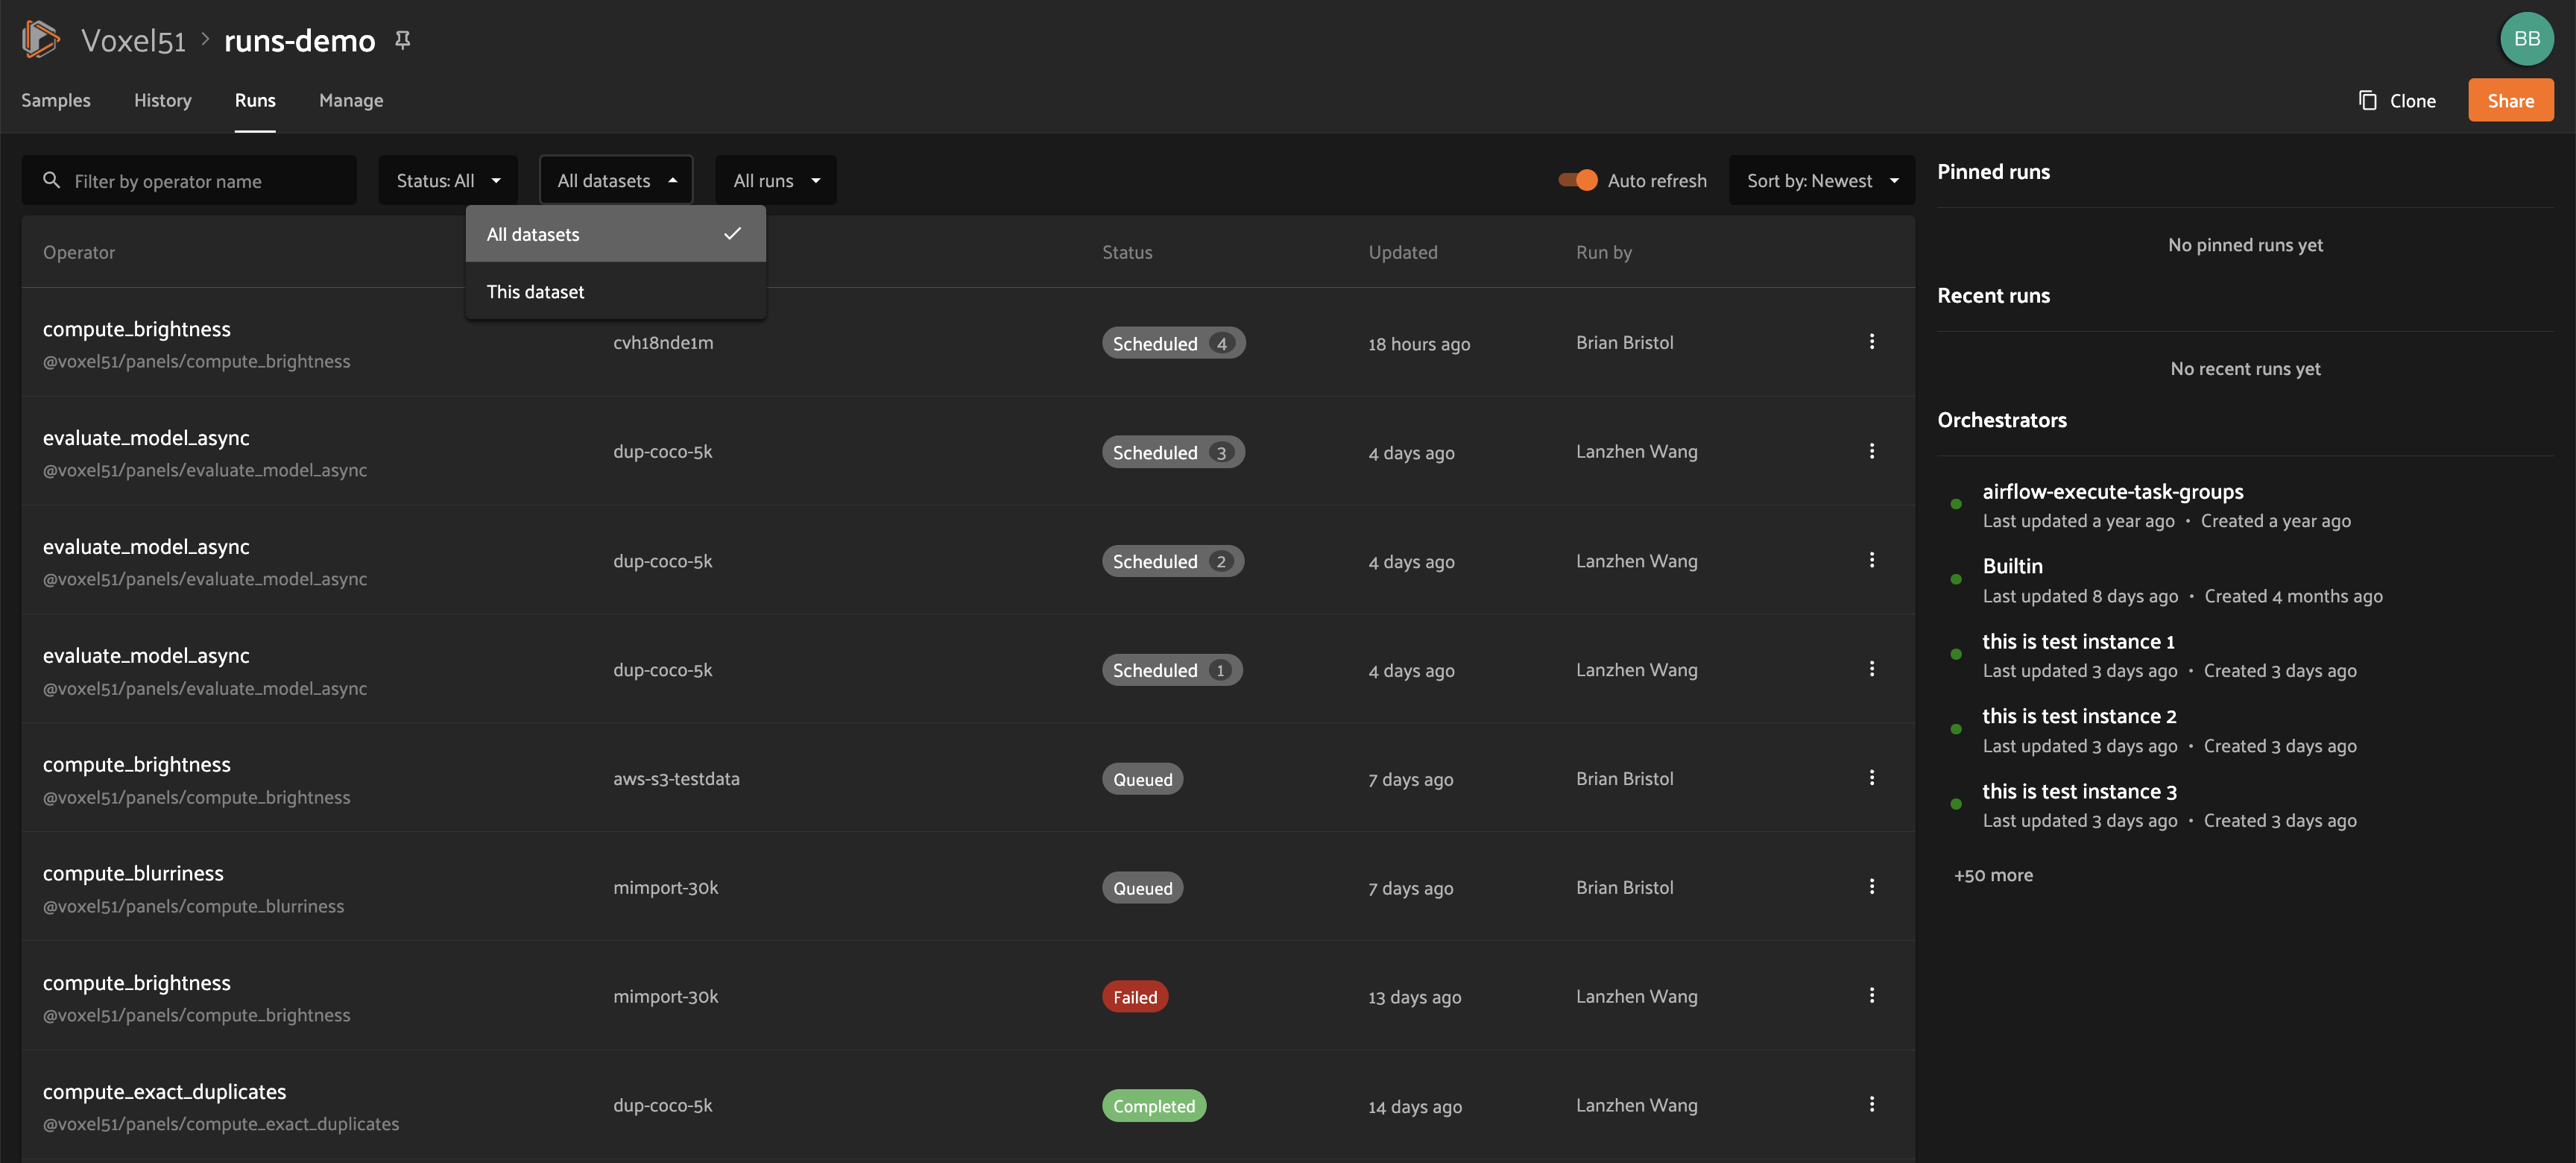
Admins can also toggle to show “All Datasets” or “This Dataset” to control whether to show all runs for your organization versus only runs for the dataset you are currently viewing:
Searching#
You can also use the search functionality to filter the list of runs by keyword. As you type your query in the search box, the list of runs will be updated to show only the runs matching your query:
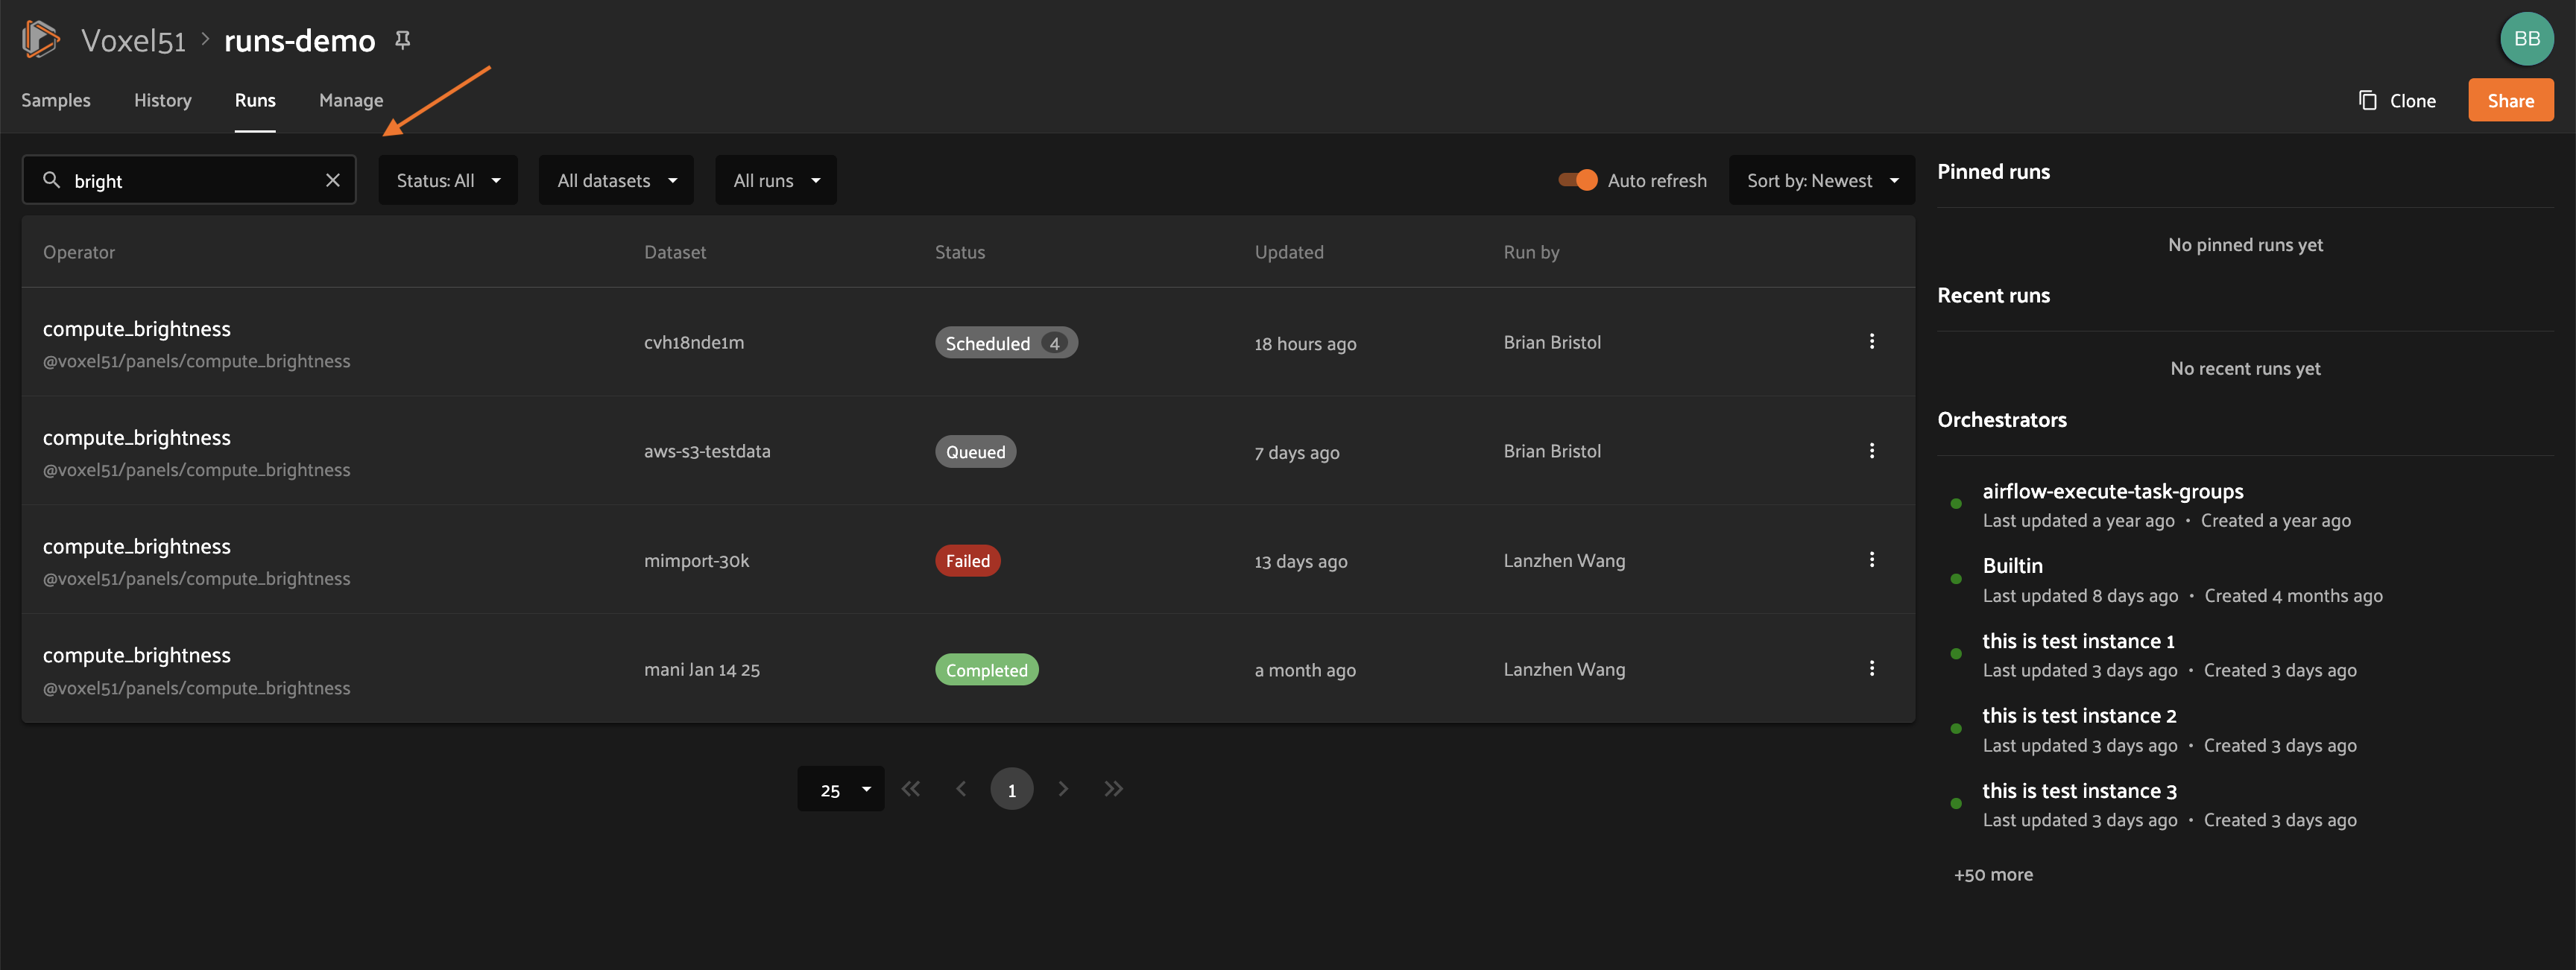
Note
Search is case-sensitive and you can currently only search by operator name, not label. For example, the search “bright” does not match against the label “compute_brightness” in the image above but instead the operator URI “@voxel51/panels/compute_brightness”.
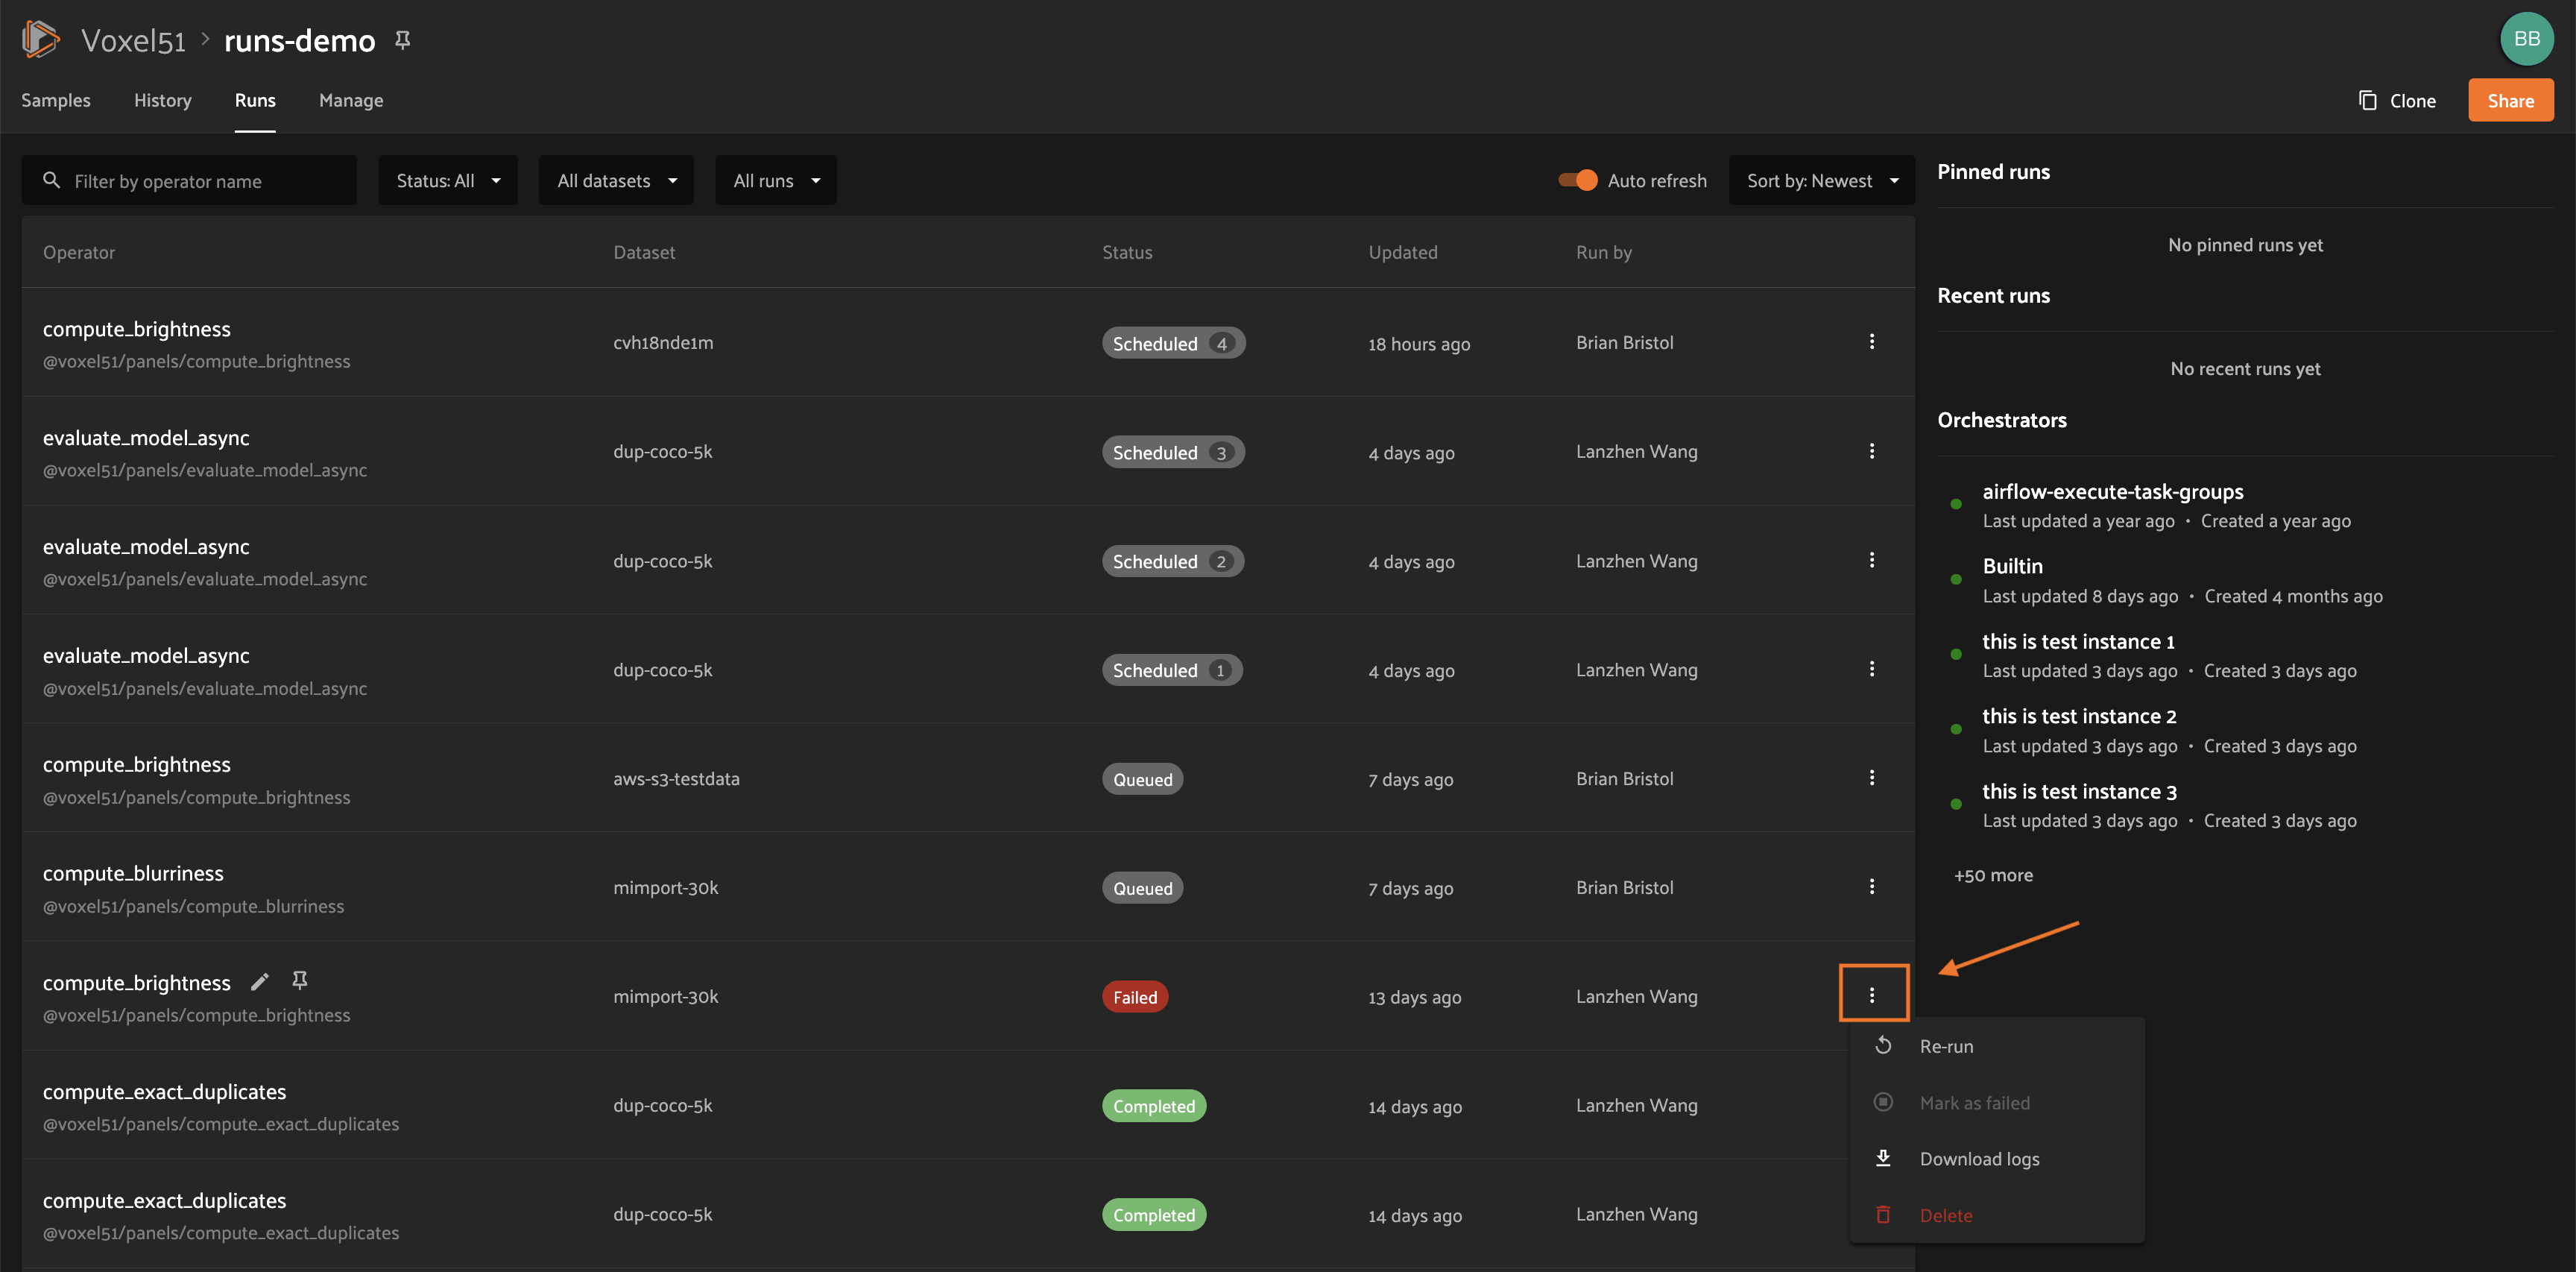
Re-running#
From the Runs page, you can trigger a re-run of any run by clicking the kebab menu and selecting “Re-run”:
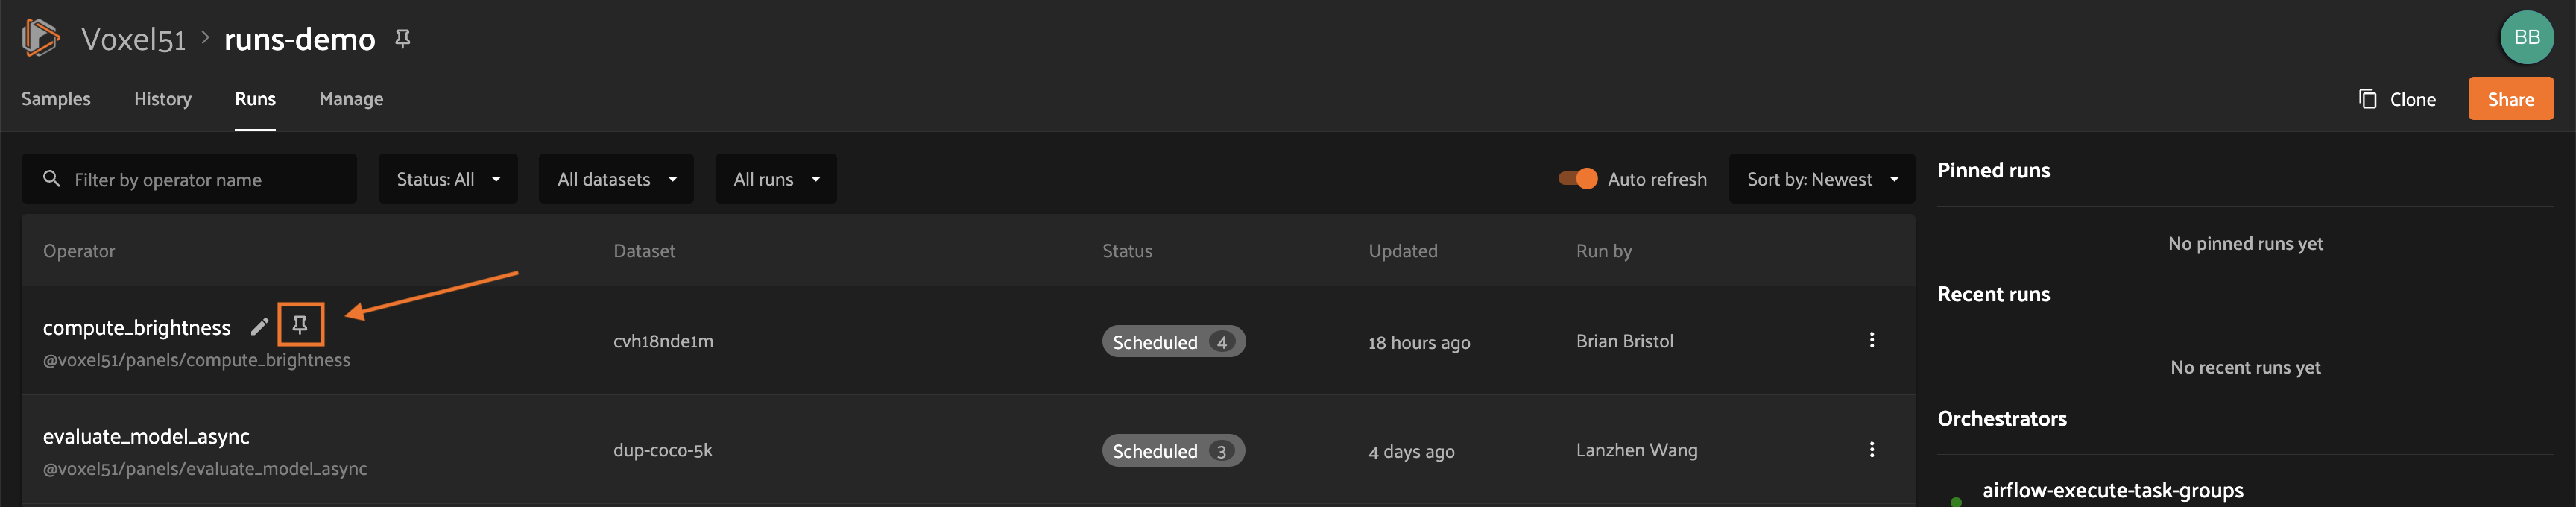
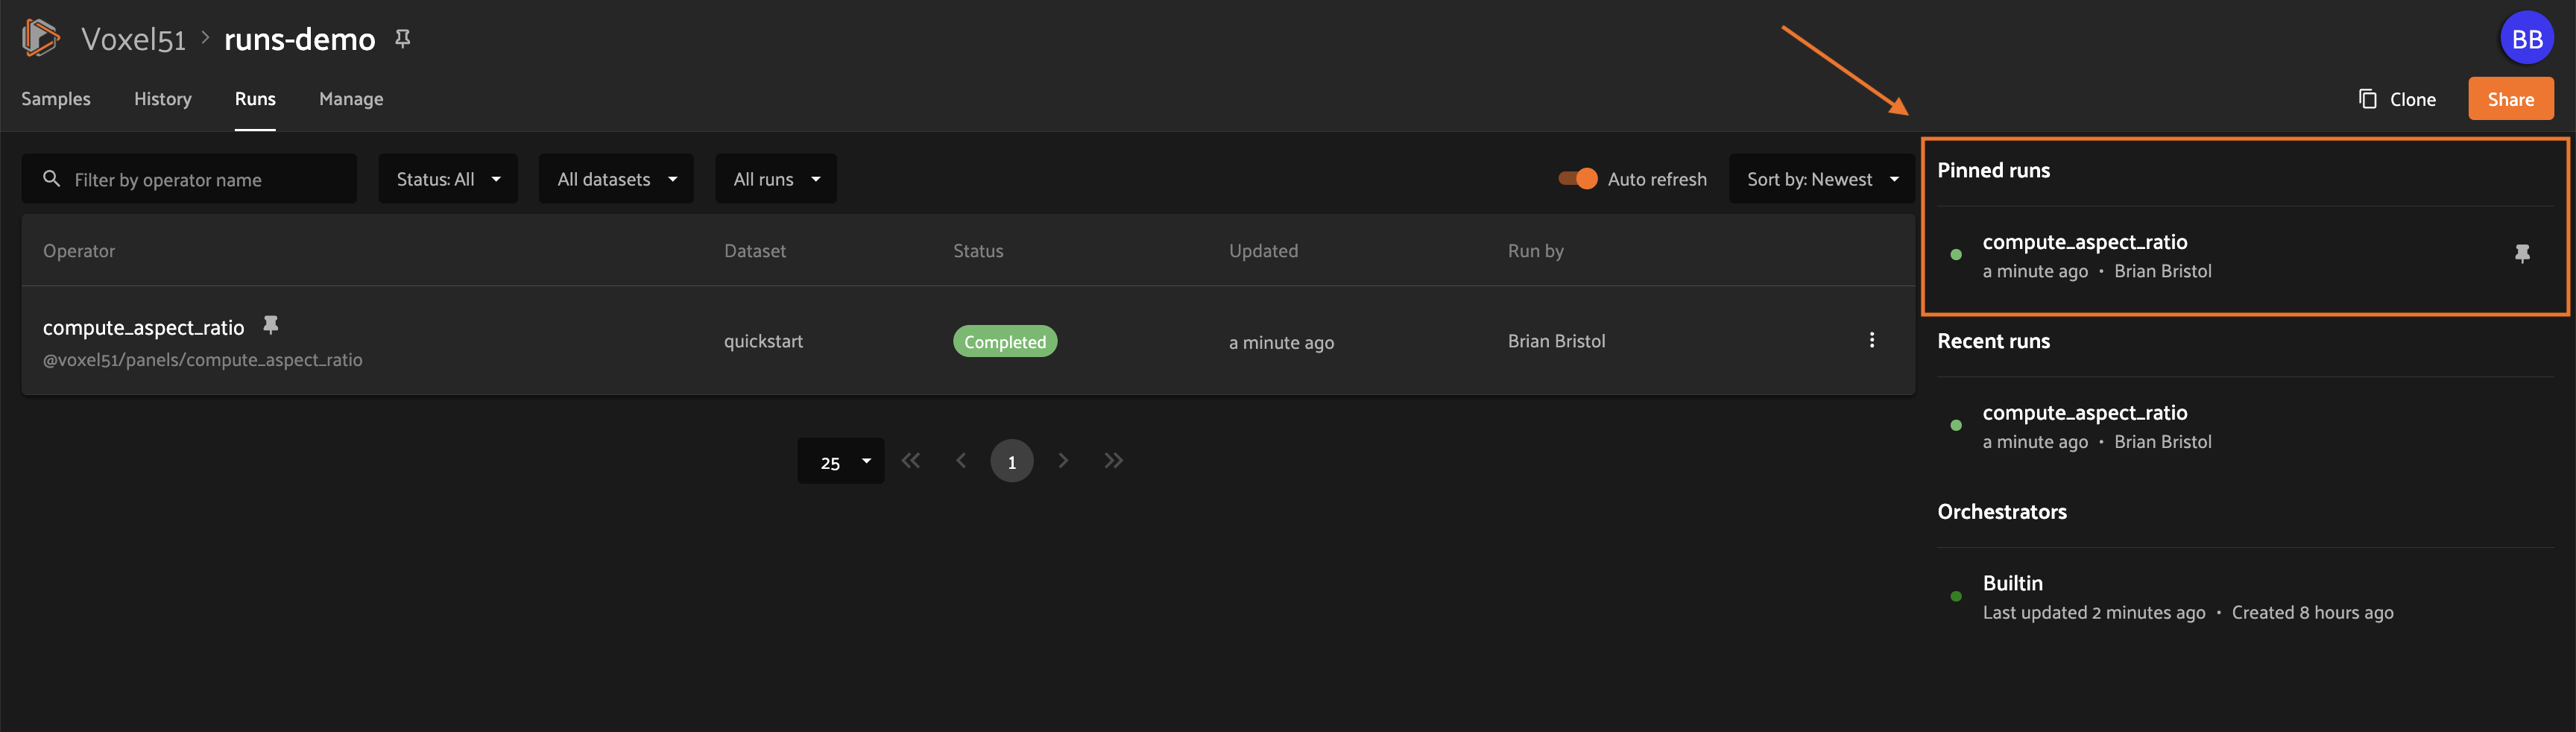
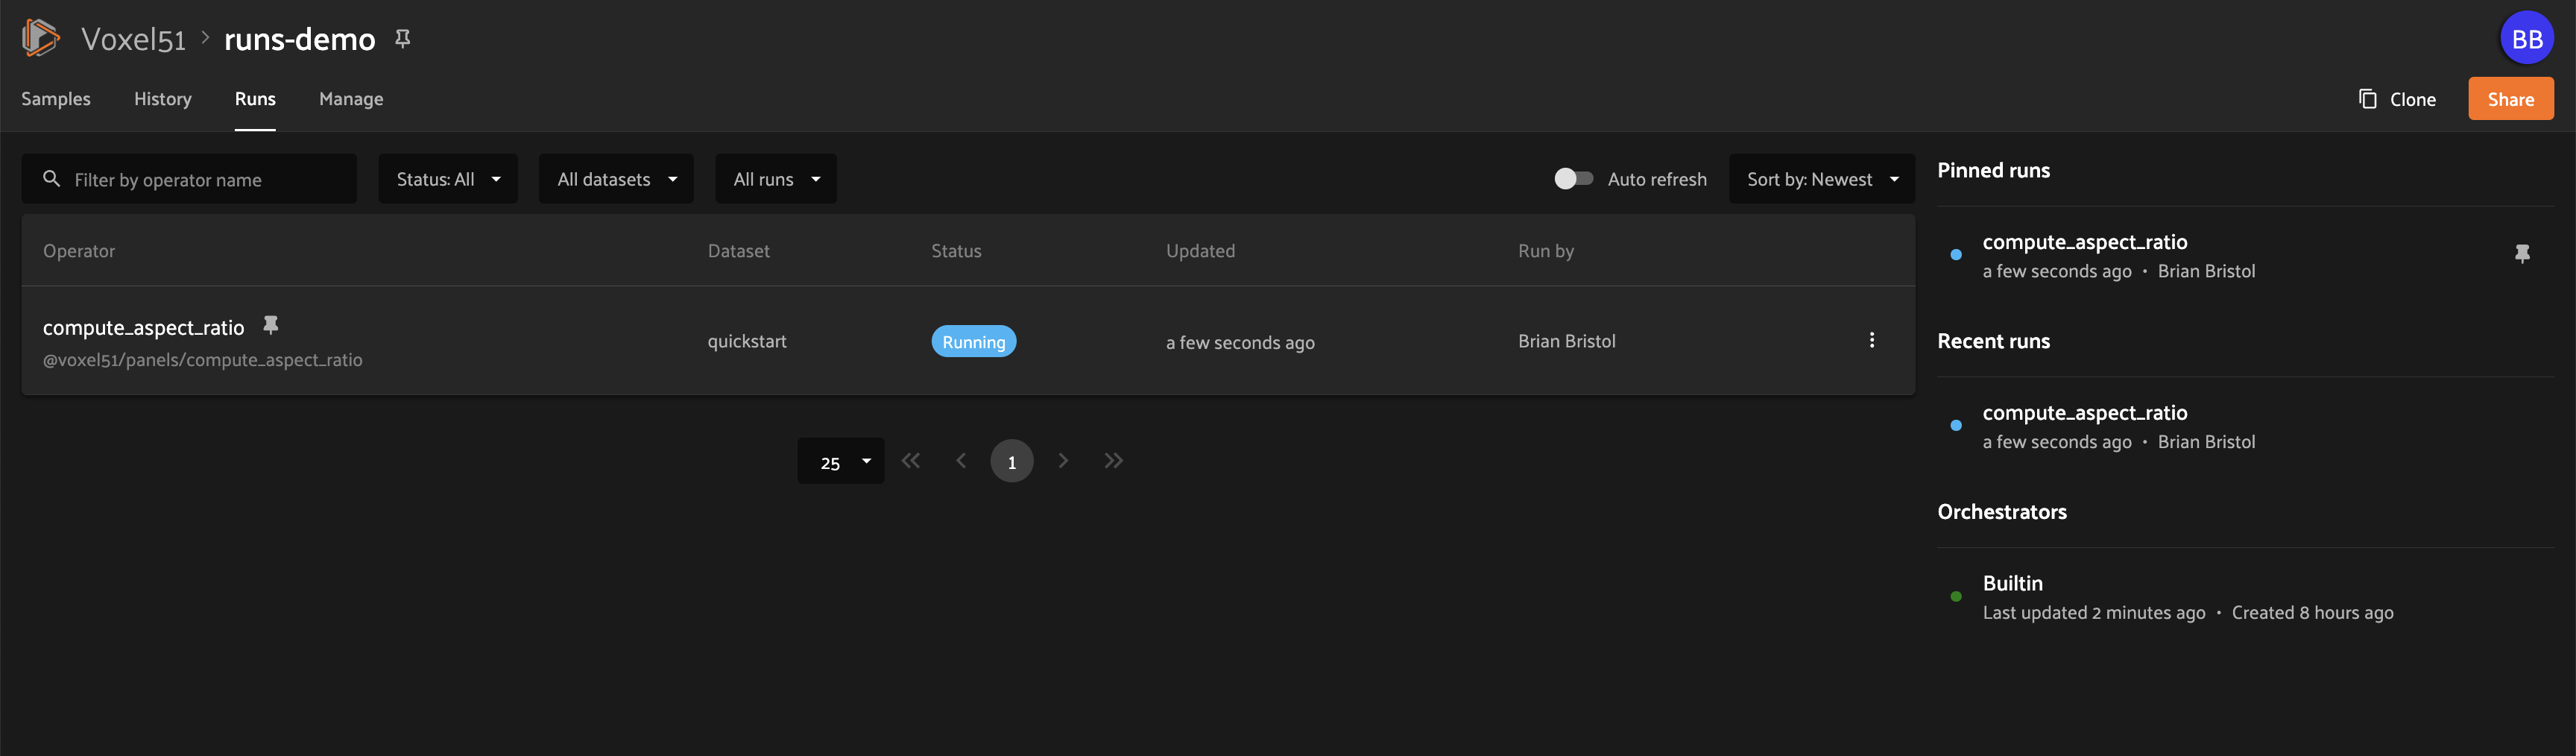
Pinning#
Pinned runs are displayed to the right of the runs table. By default, five pinned runs will be displayed, and if there are more than five pinned runs, you will see a button to expand the list.
To pin a run, hover over its row in the runs table and click the pin icon that appears beside the operator label:
Note
Pinned runs are stored at the dataset-level and will be visible to all users with access to that dataset.
Renaming#
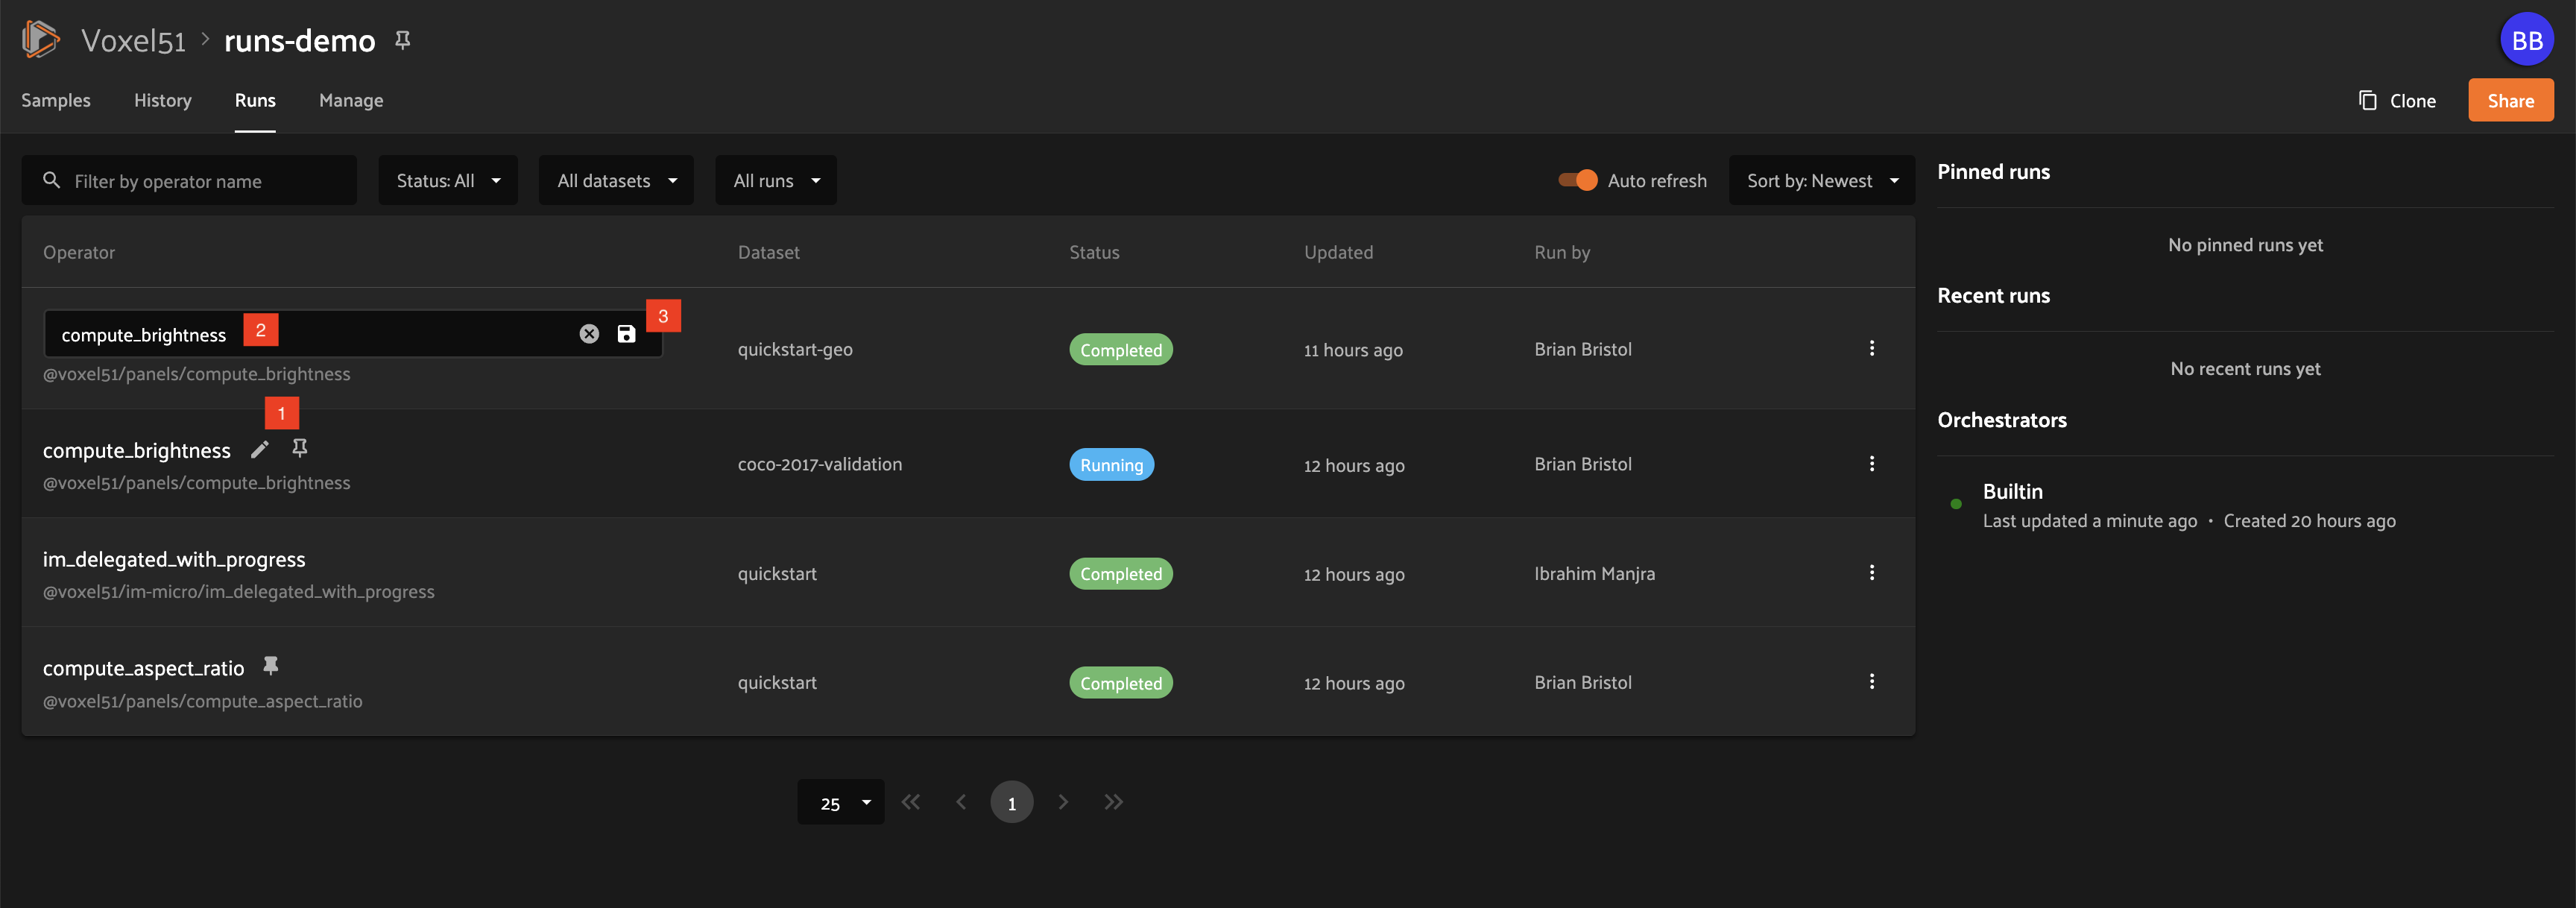
When delegating an operation multiple times on the same dataset, you may wish to give the runs custom labels so that you can easily identify each run later.
To edit the label of an operator run, move your mouse cursor over the label of interest and click the pencil button as indicated by “1” below. This will present an input field indicated by “2” where you can update the label to the text of your choice. Once you are ready to apply changes, click the save button indicated by “3”:
Terminate#
To terminate a run, click the three dots indicated by “1”. Then, in the menu, click “Terminate” as indicated by “2”. The run status will be updated and will now display as failed:
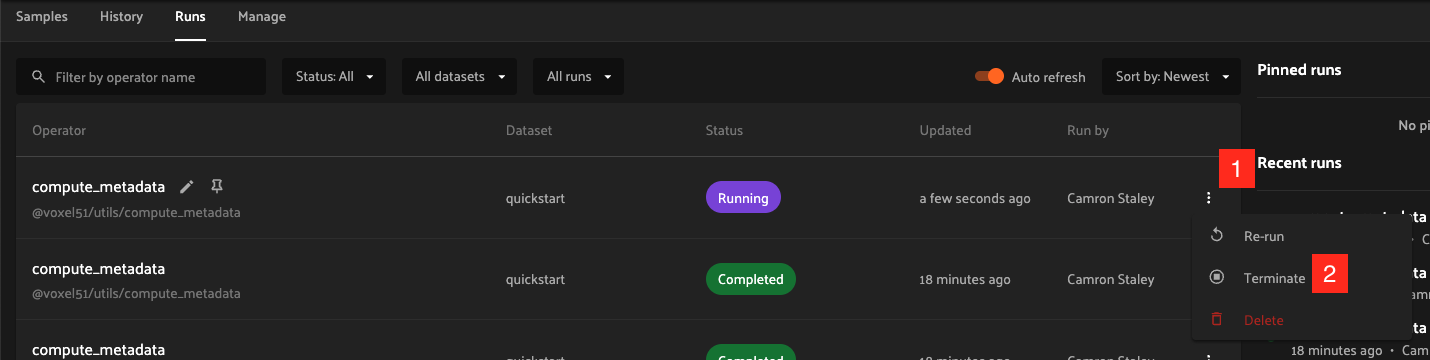
Changed in version 2.12.0: The “Terminate” action now actually stops running delegated operations.
Note
If you are running a version older than 2.12.0, the button will say “Mark as Failed” instead of “Terminate”, and it will not stop the operation on your orchestrator-it will only mark the run as failed while the operation continues executing.
Monitoring progress#
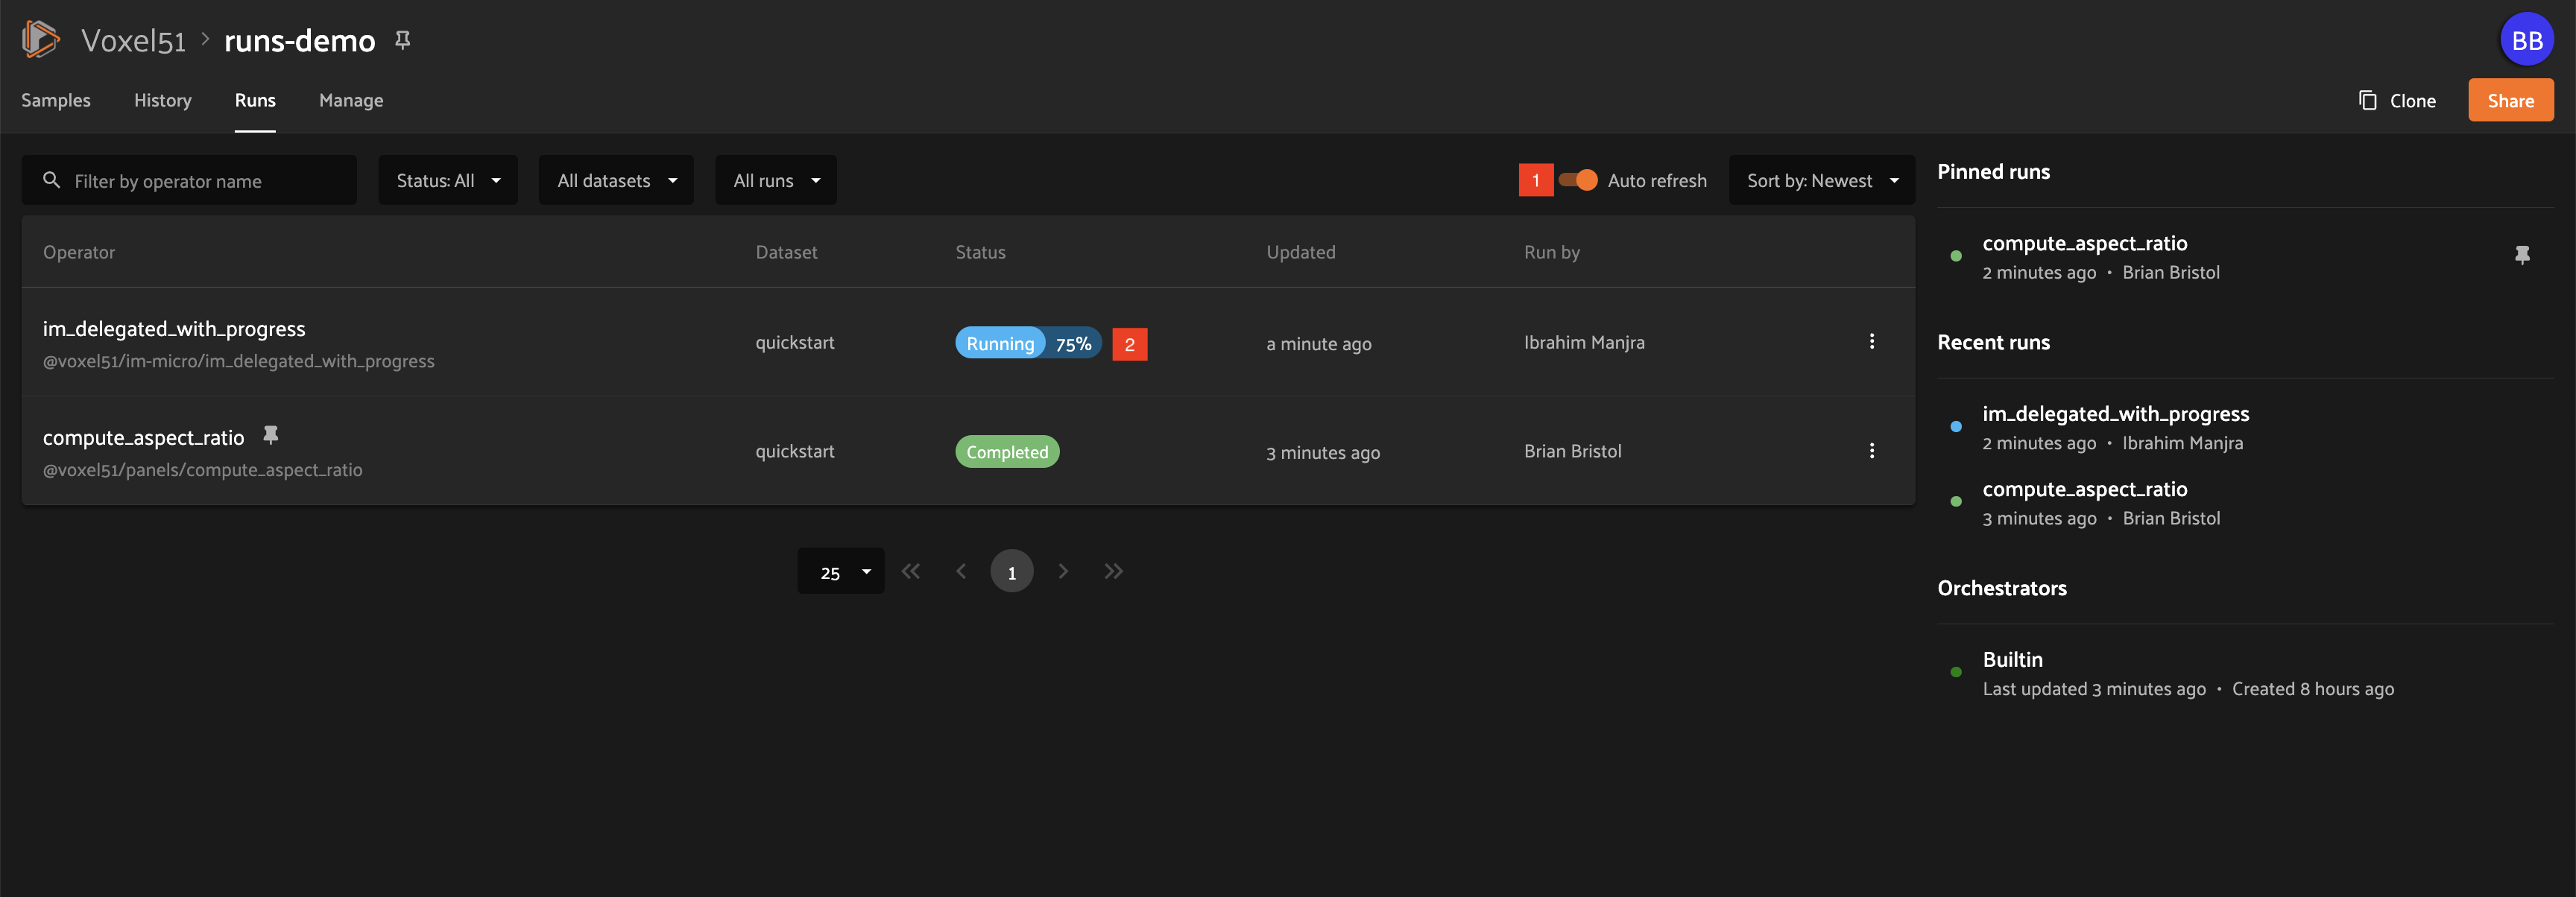
Delegated operations can optionally report their progress during execution.
If progress is available for a run, it will be displayed in the Runs table as indicated by “2”.
By default, the general status of a run and the progress of running operations is automatically refreshed. You can disable the auto-refresh of running operations by toggling the auto-refresh setting indicated by “1”.
Run page#
The Run page for a specific run allows you to see information about a specific delegated operation, including its inputs, outputs, logs, and errors.
You can visit the Run page for a run by clicking on the run in the runs table, the Pinned runs section, or the Recent runs widgets.
Children#
Added in version 2.11.0.
If a distributable delegated operation was scheduled with multiple tasks, then it’s considered to be a “parent”. The Run page will include a Children tab that allows you to see the status of each individual child task in a tabular format similar to the main Runs page:
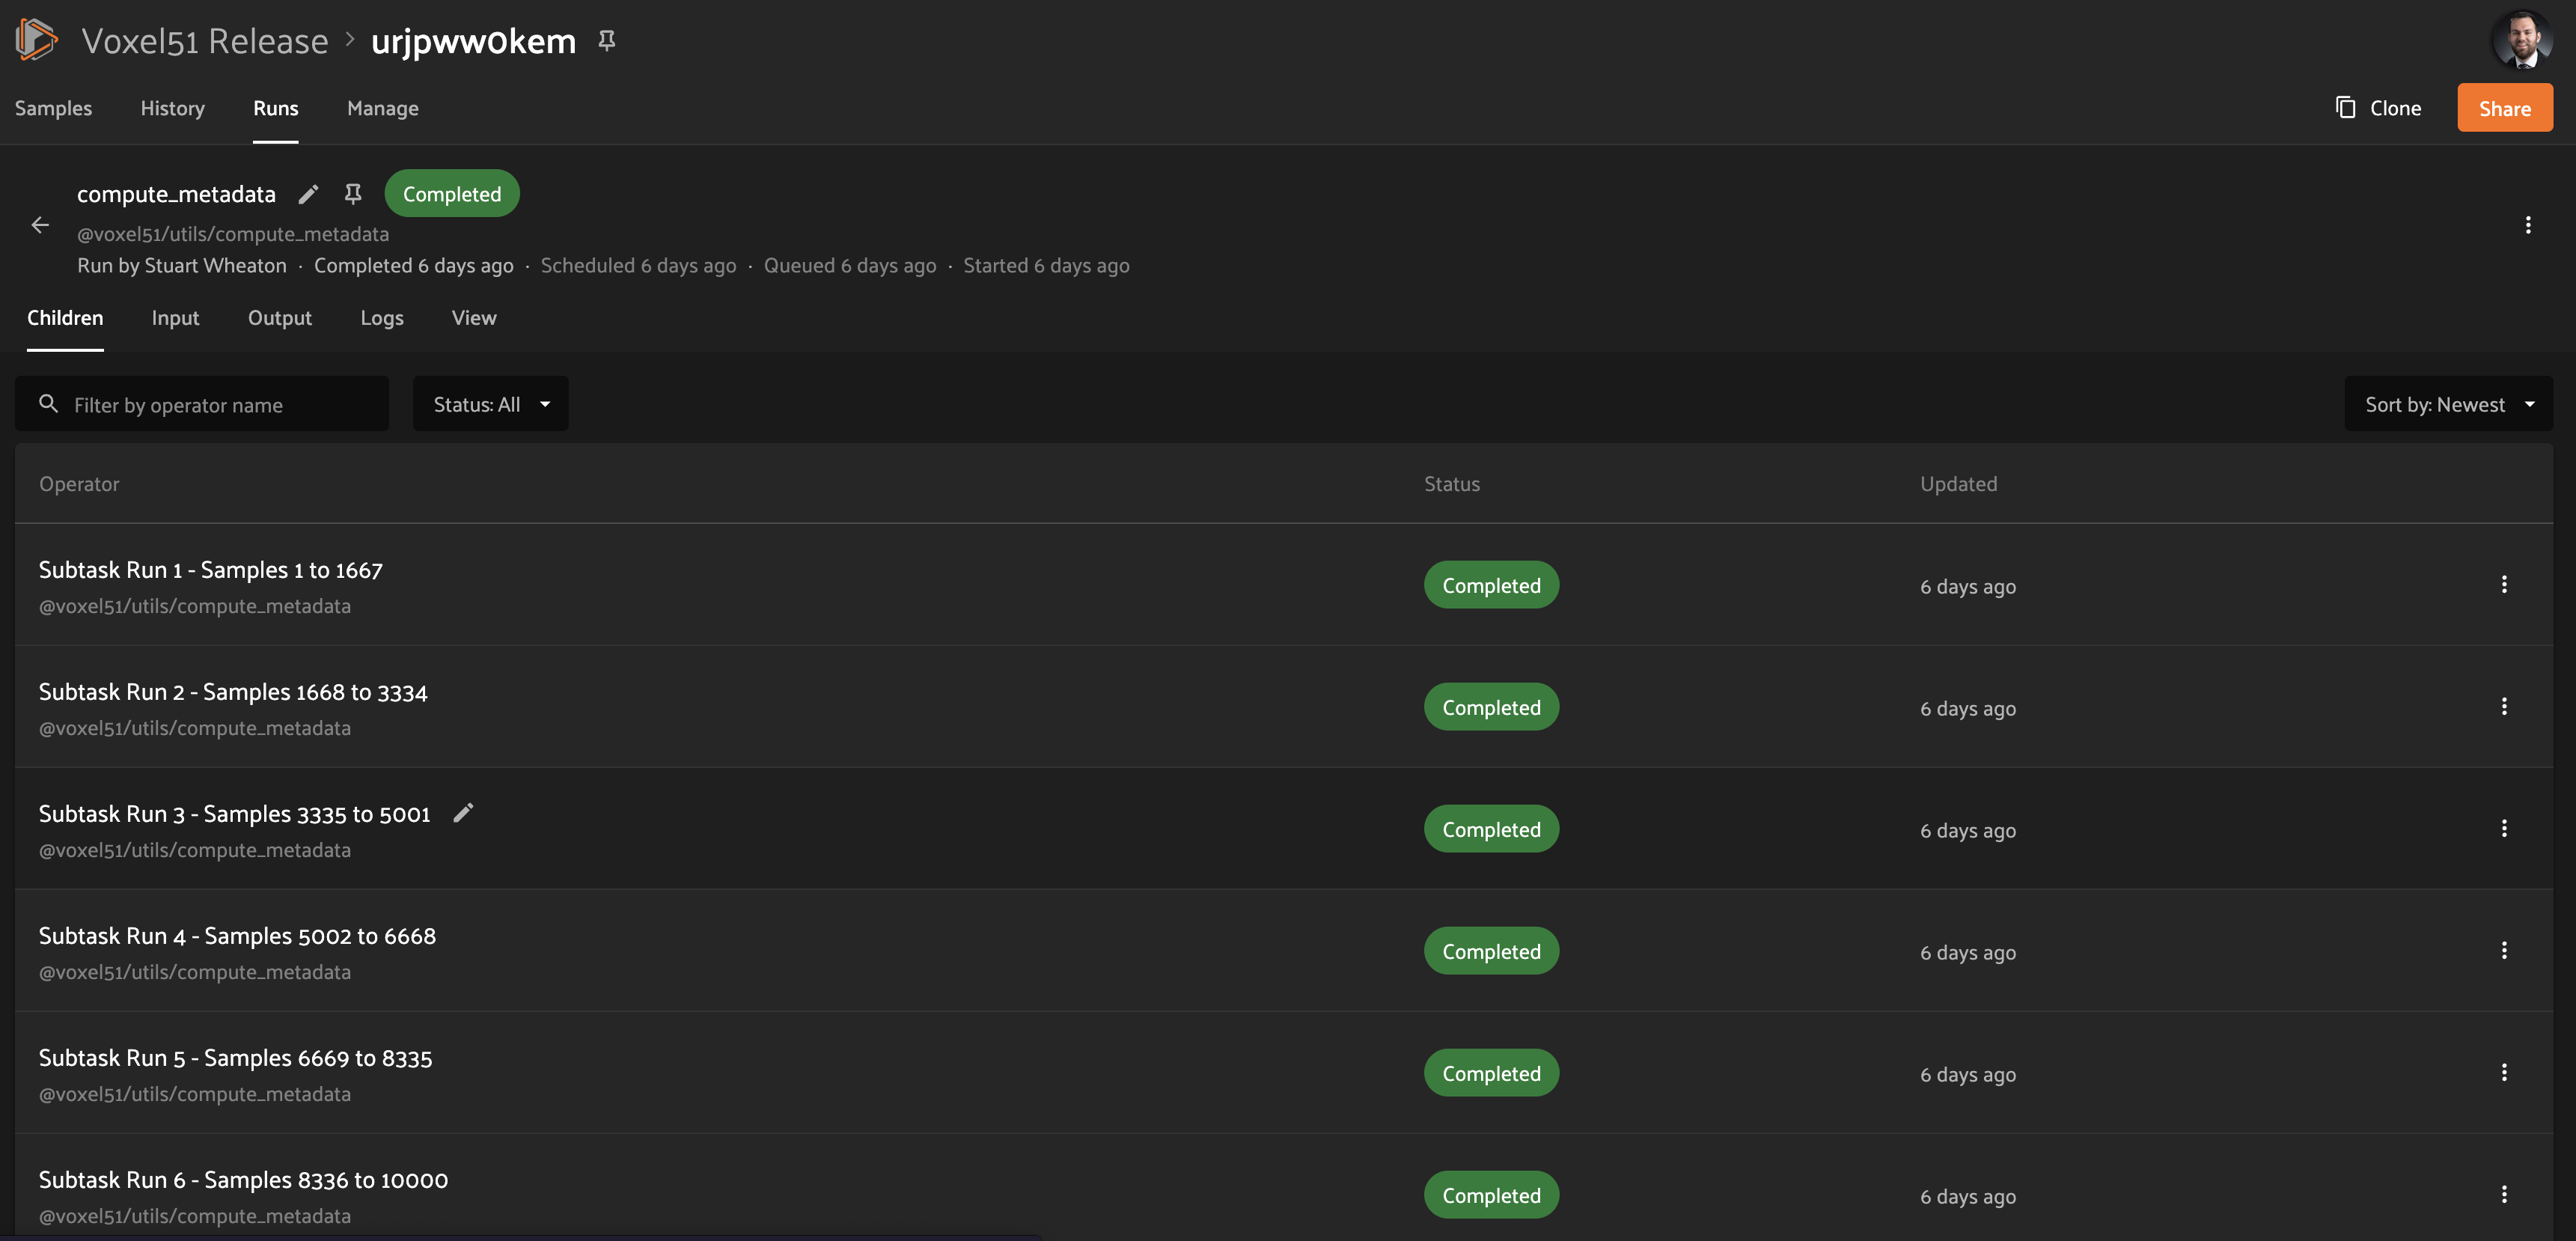
You are given options to sort, search, and filter the list of tasks as you would on the main Runs page. You can also click on any task in the table to visit its own Run page.
Note
You can mark a child task as failed, but you cannot re-run or delete a child task individually.
Input#
The Input tab on the Run page lets you see the input parameters that were provided when the delegated operation was scheduled:
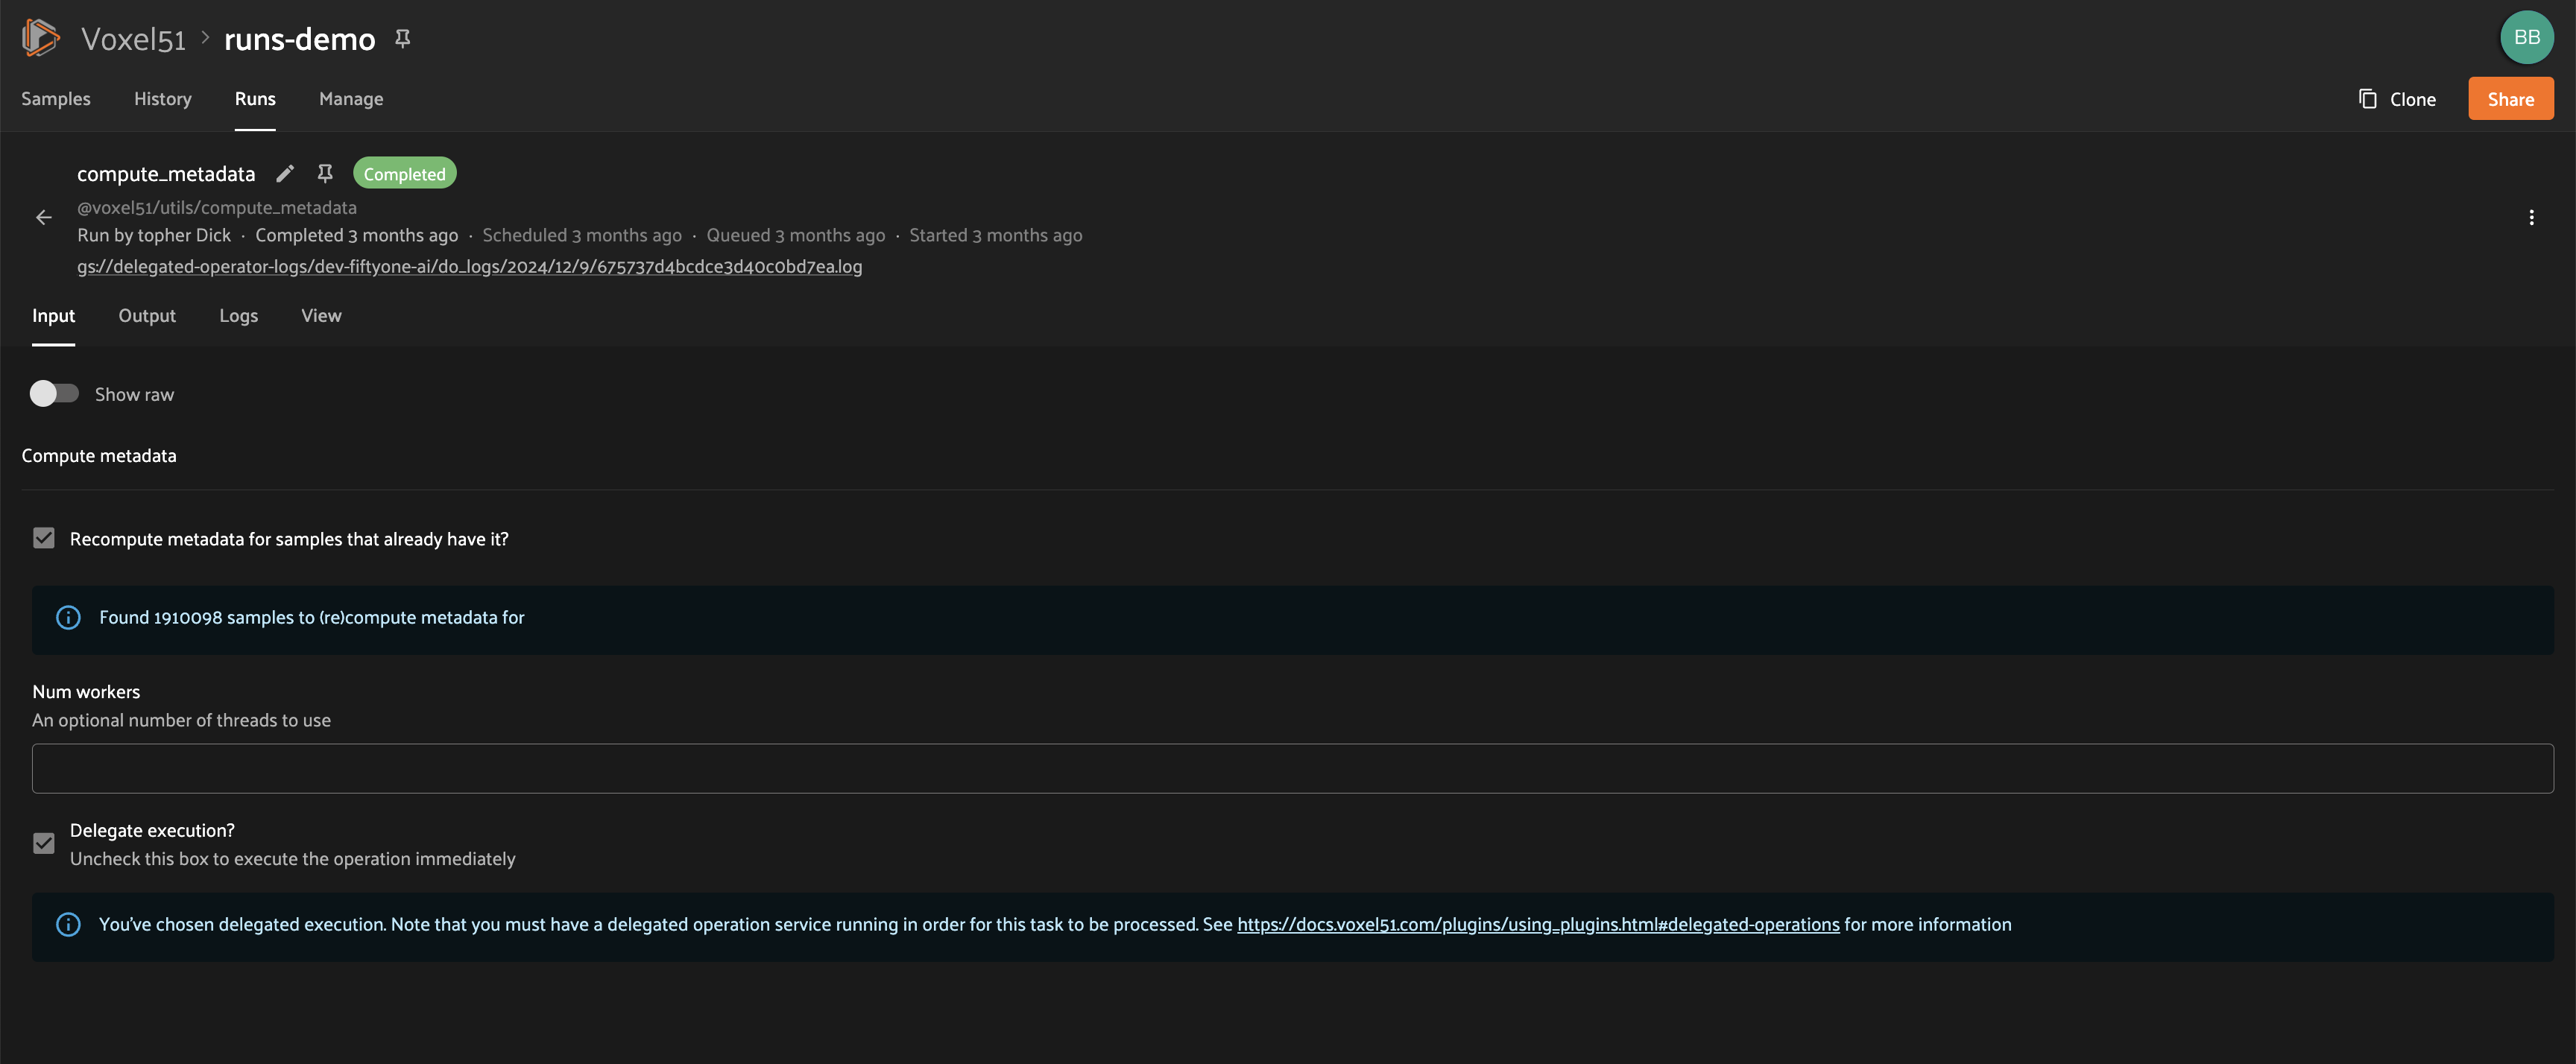
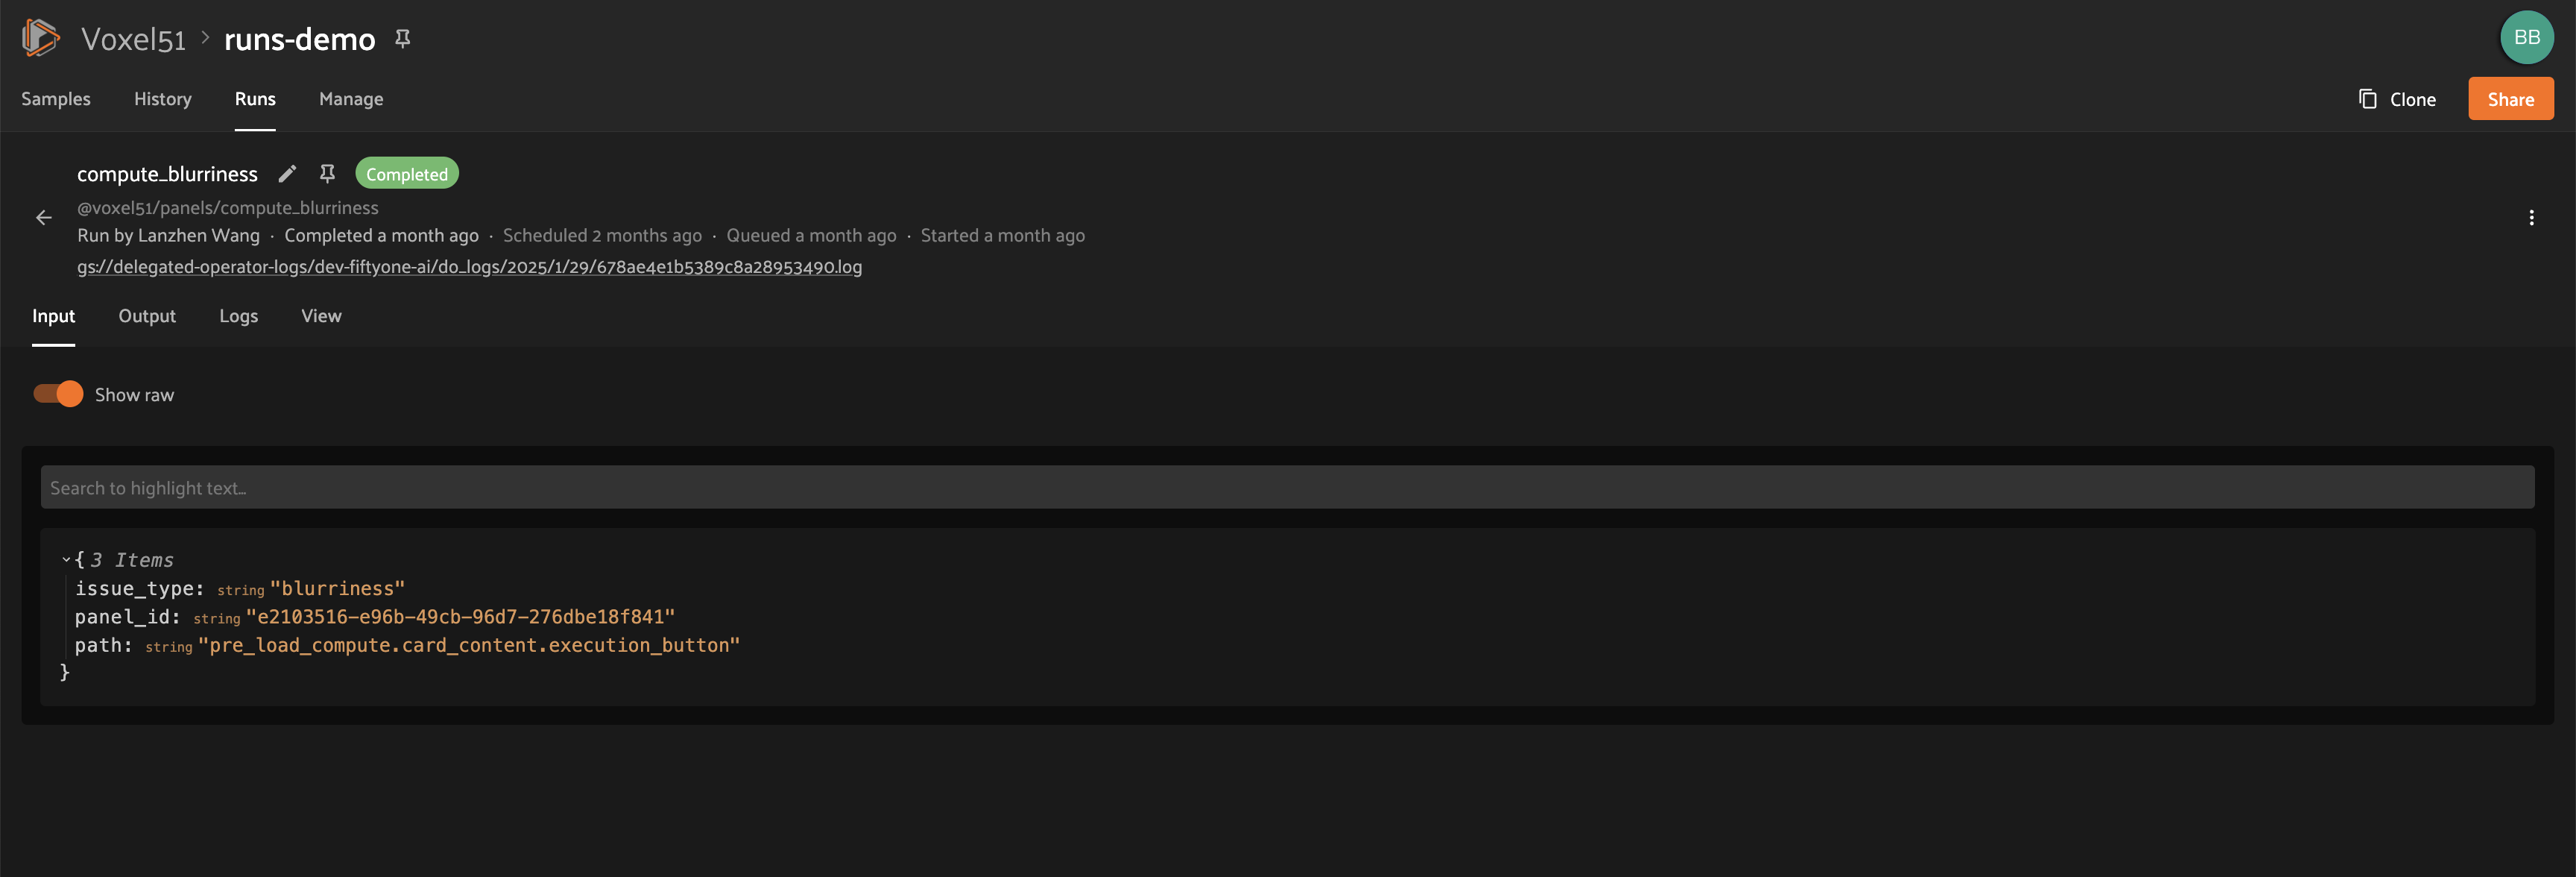
By default, a rendered version of input parameters is displayed, similar to what is displayed when invoking an operator via a prompt modal. However, you can switch to raw format by clicking the “Show raw” toggle button:
Output#
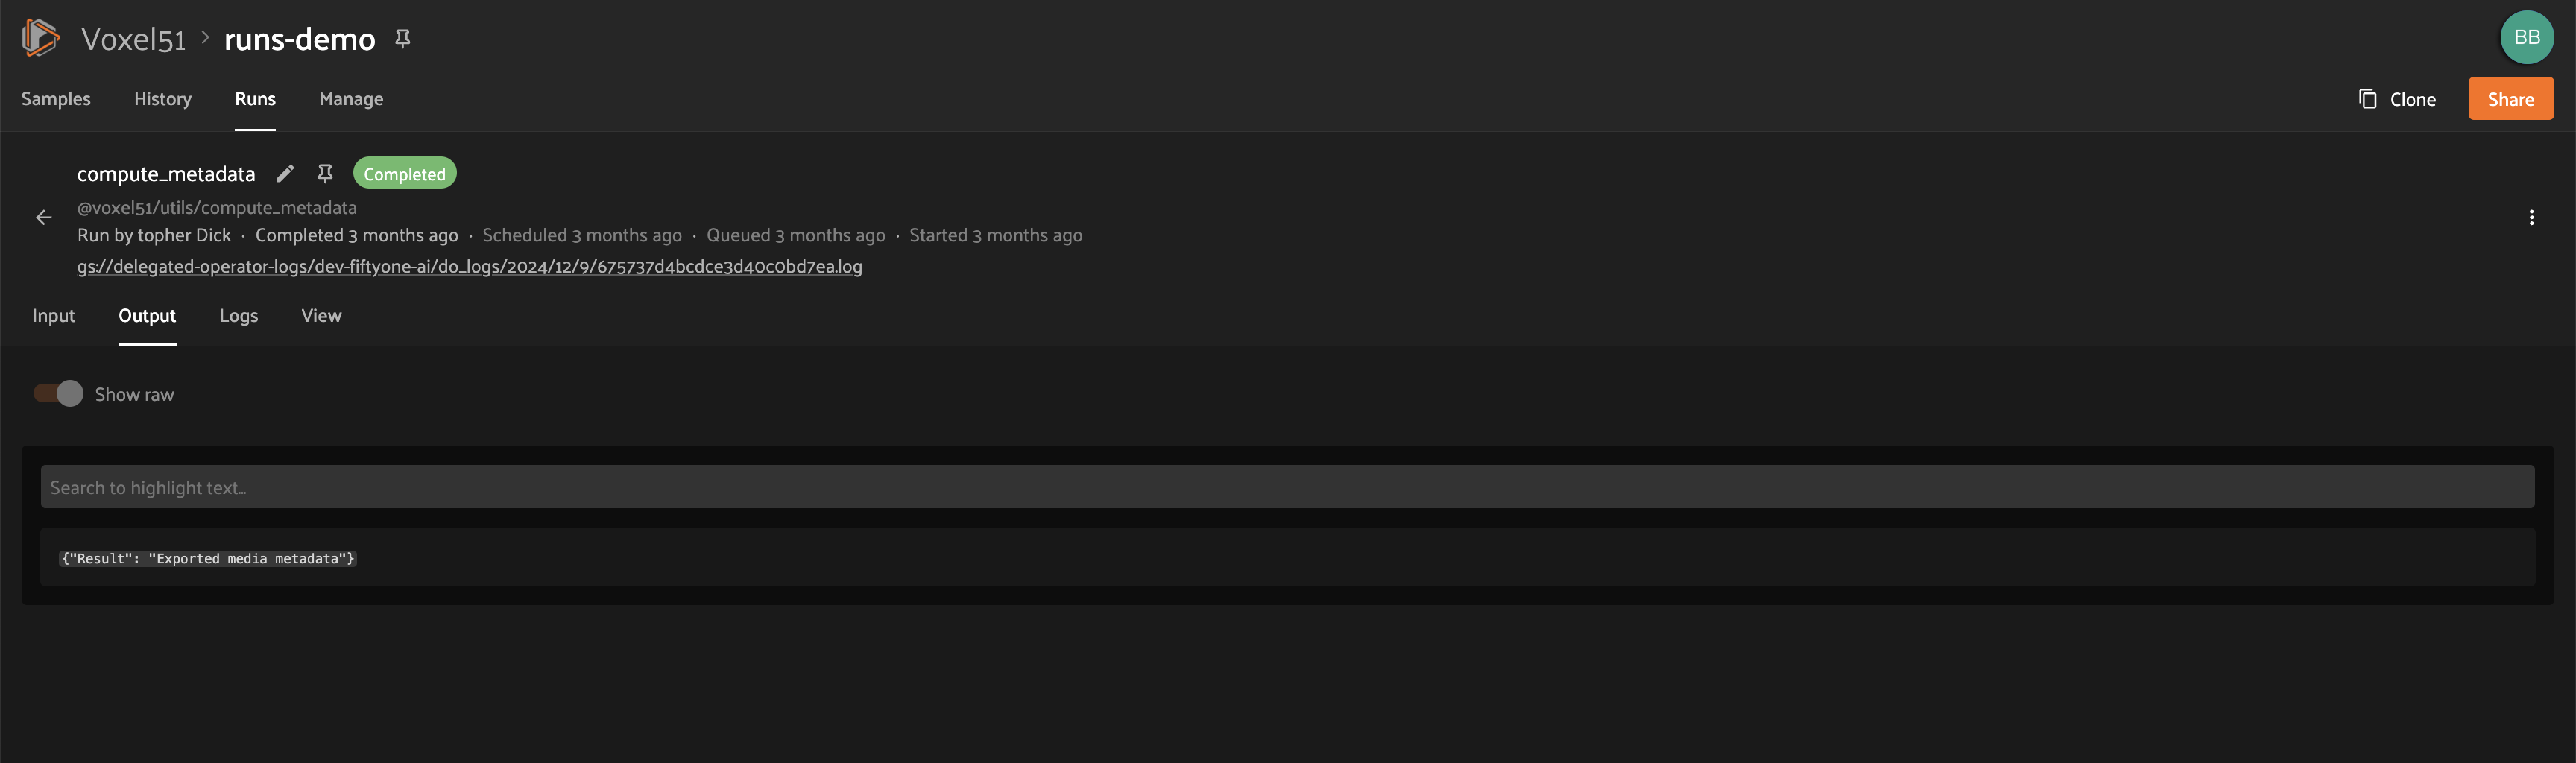
The Output tab on the Run page lets you see the rendered output of a delegated operation that has completed, if there is any:
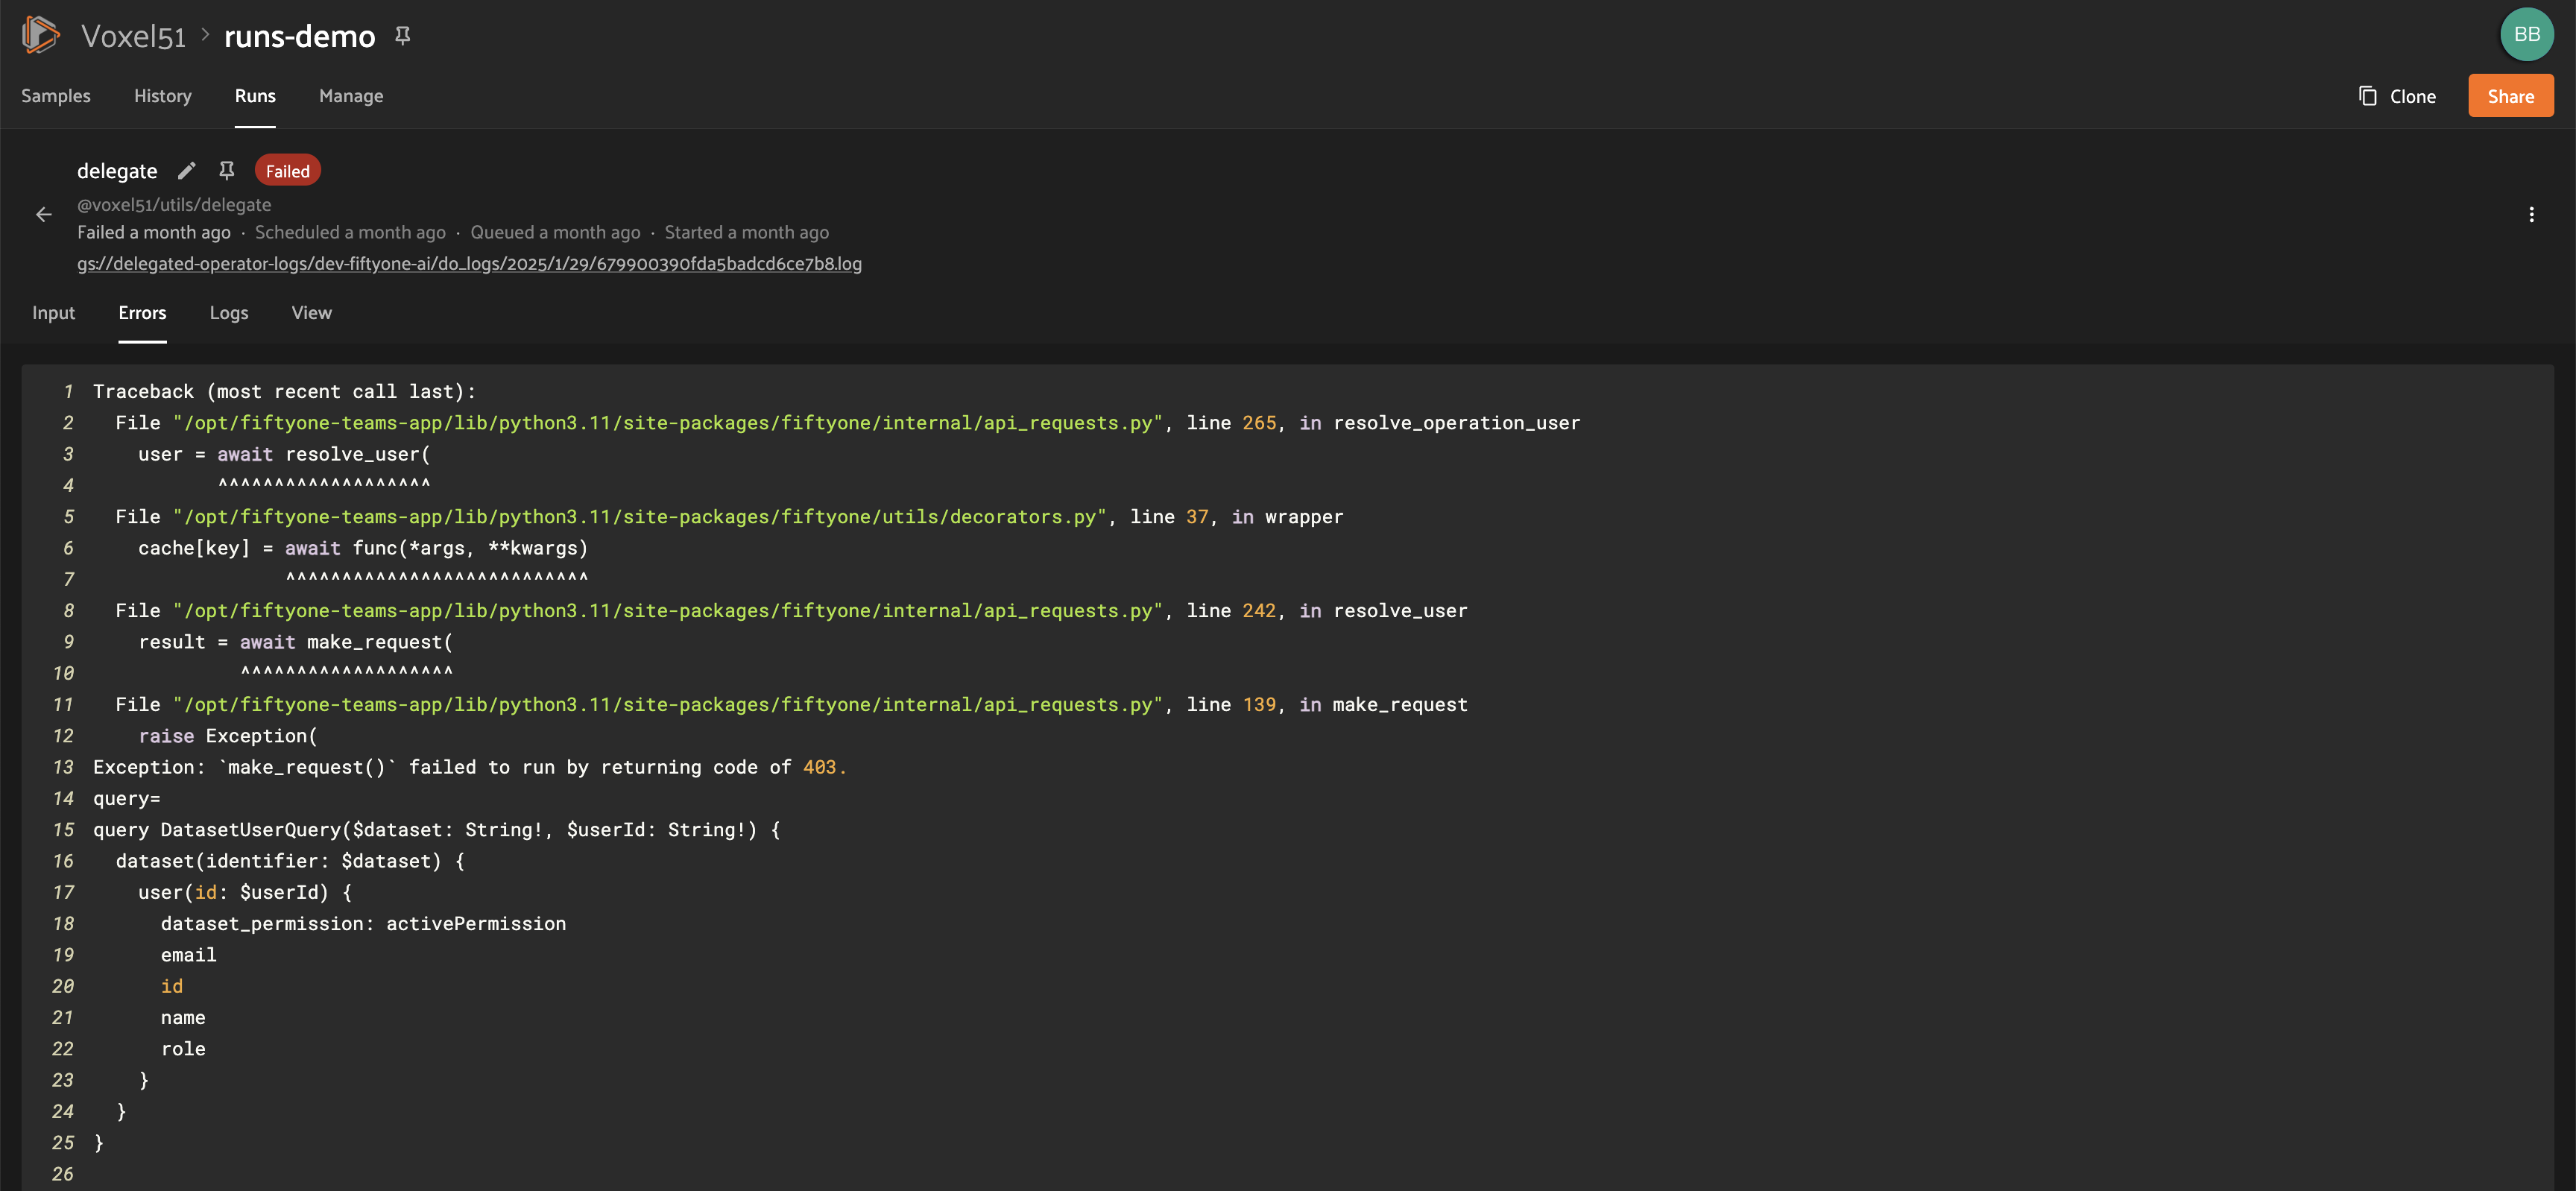
Errors#
The Errors tab on the Run page will appear if the run failed, and it will display the error message and stack trace that occurred:
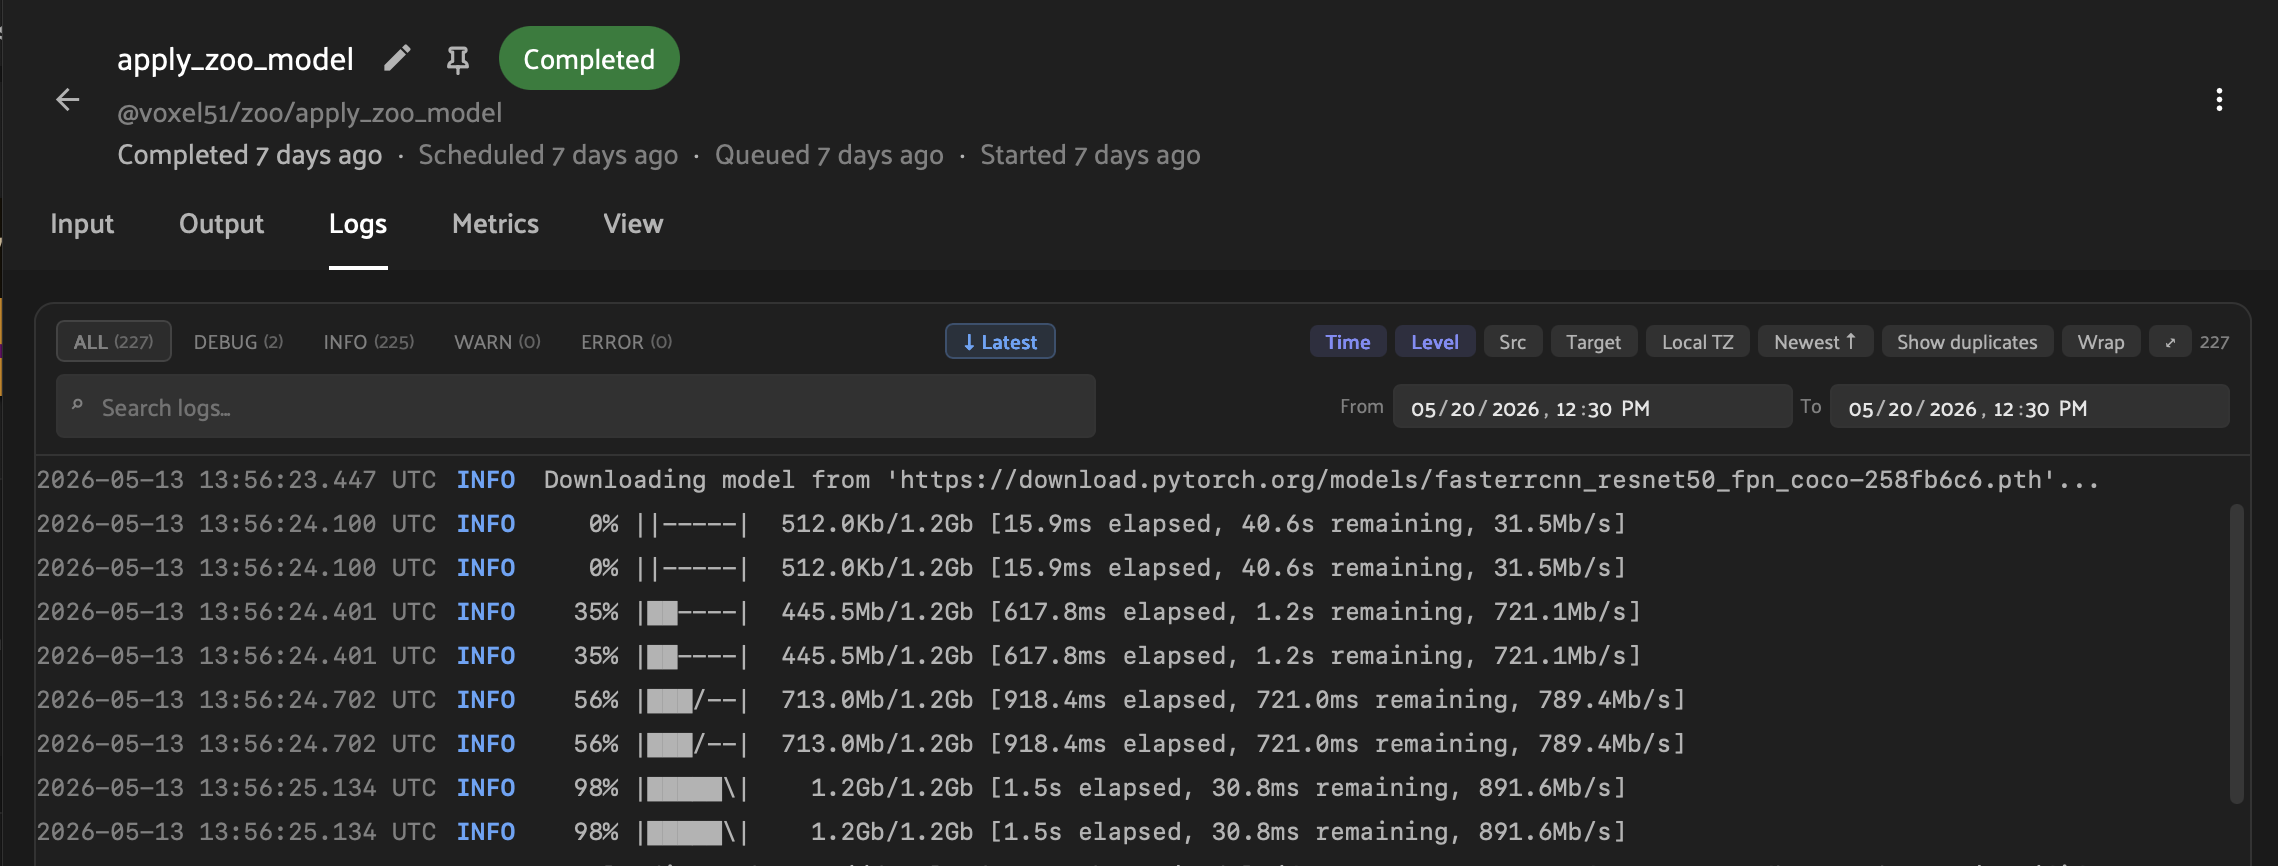
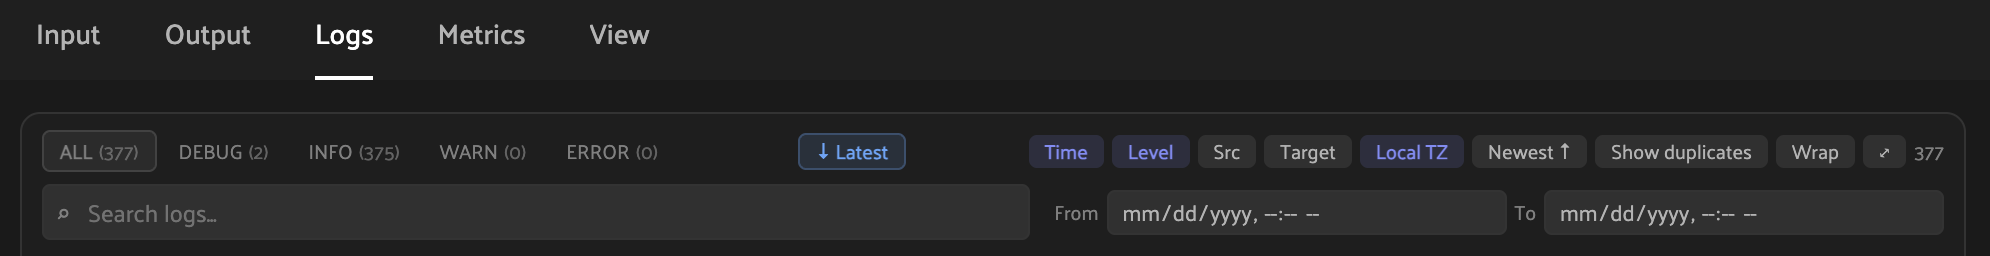
Logs#
The Logs tab on the Run page allows you to view logs for a delegated operation.
Note
Logs are only available for delegated operations that were executed on the builtin FiftyOne Orchestrator. If you are using an external orchestrator, log availability depends on your specific integration and configuration.
Viewing logs
Logs are stored in MongoDB and are available in the Logs tab both while a run is in progress and after it completes.
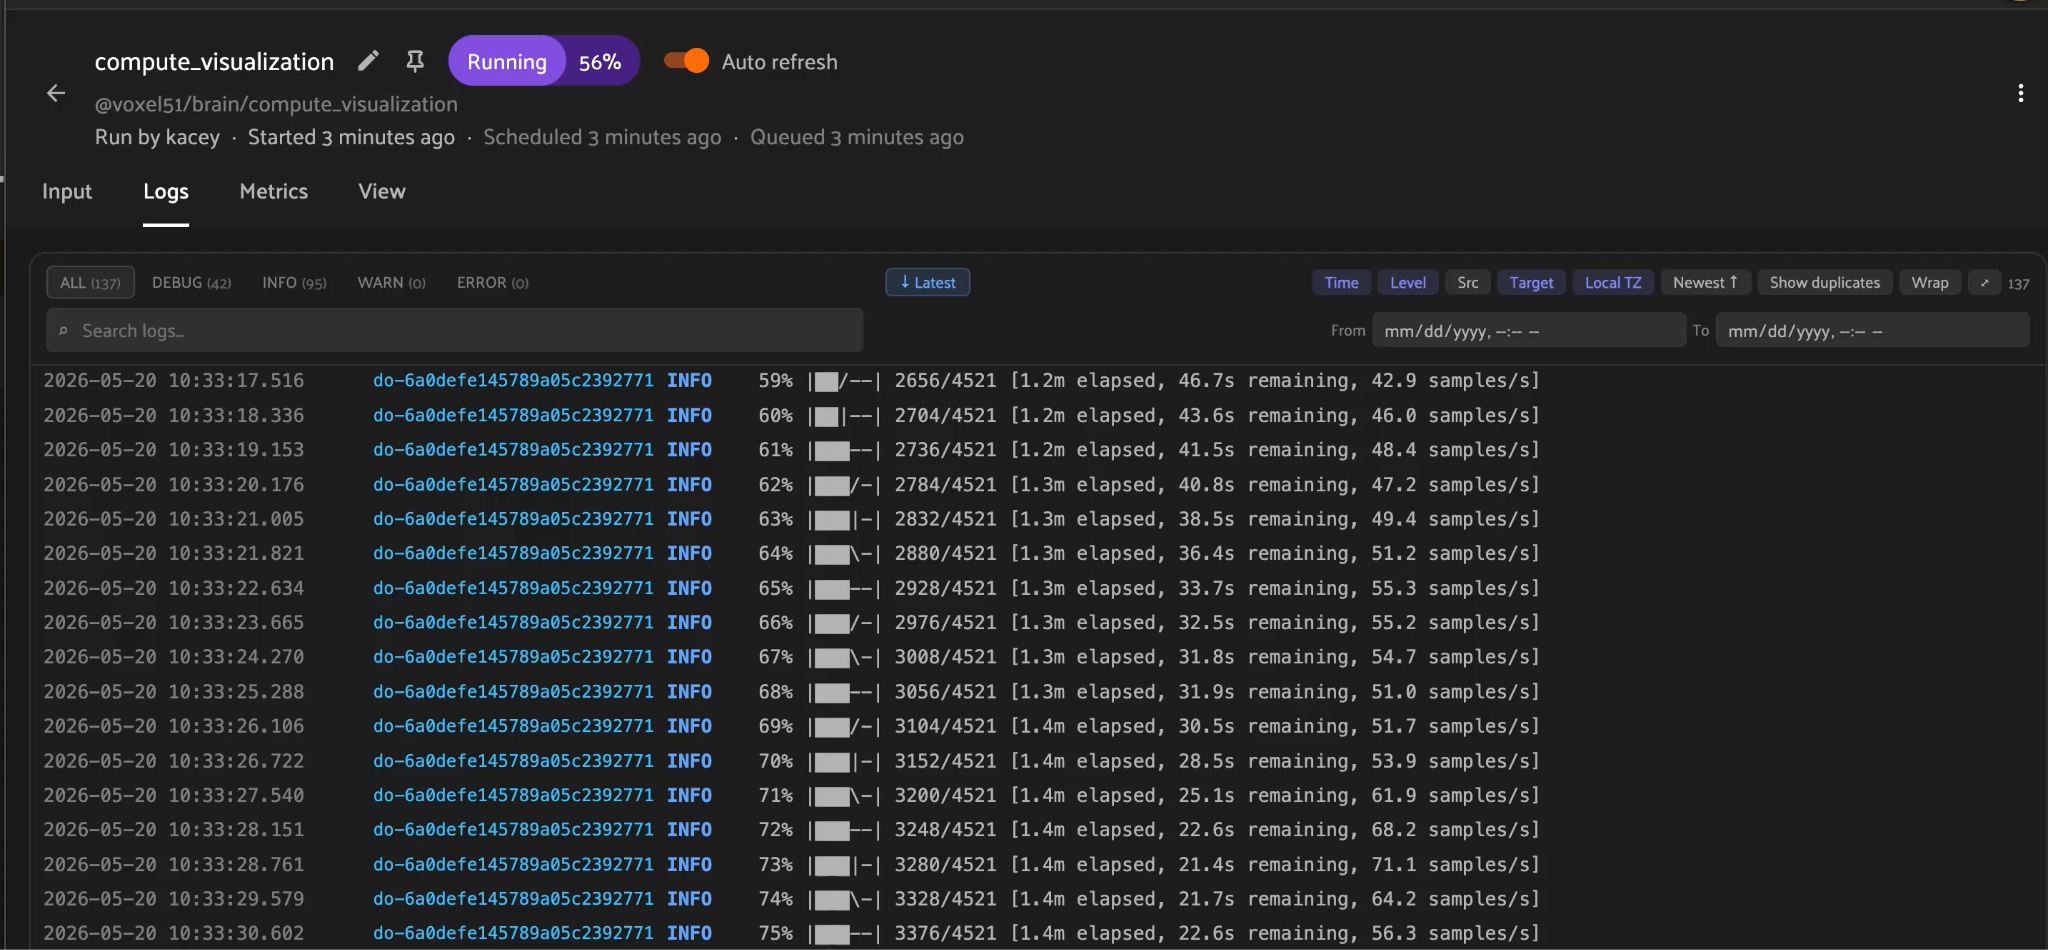
Logs are displayed in a tabular format. You can click the icons to toggle the visibility of columns, show timestamps in your local timezone, filter logs by severity. You can also search for specific keywords or limit the logs to a custom time range.
Log retention and archival
By default, delegated operation logs are retained in MongoDB for 30 days. After the retention period expires, logs are either uploaded to a cloud bucket or deleted.
The following environment variables can be set on your API pod to configure log retention behavior:
FIFTYONE_DO_LOG_RETENTION_DAYS: the number of days to retain logs in MongoDB before archiving or deleting them. Default is30.FIFTYONE_DO_LOG_BUCKET_PATH: a cloud bucket prefix where logs are uploaded after the retention period expires, e.g.gs://my-bucket/do-logsors3://my-bucket/do-logs. If unset, logs are deleted without being uploaded. Default isNone.
Once archived, you can access the logs for a particular run by clicking the “Download logs” option from the Run page:
Note
If you are using a third-party orchestrator, a run_link can be
added to each run to link back to the external run details page.
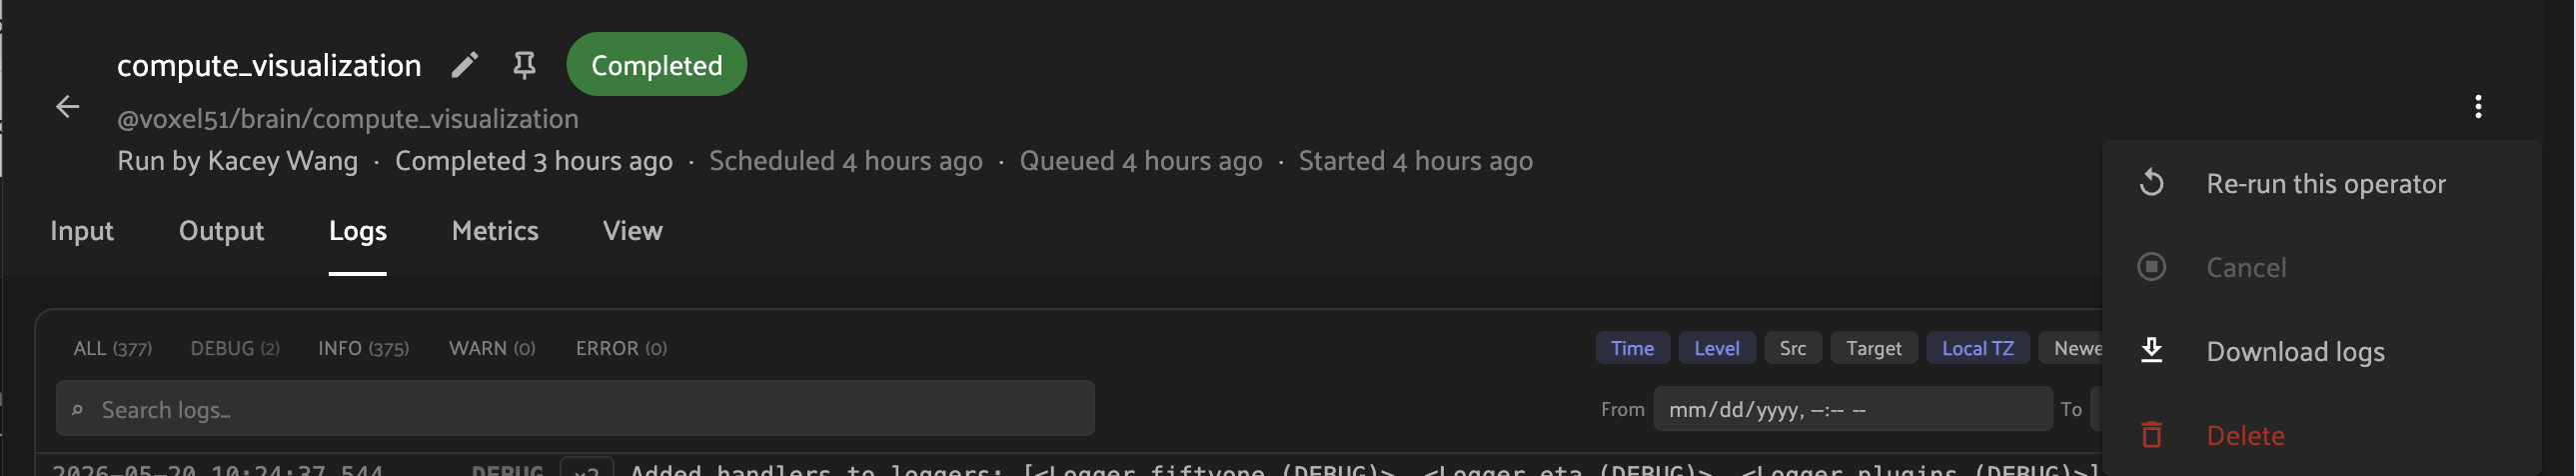
Metrics#
The Metrics tab on the Run page allows you to view any metrics that were collected during the execution of the delegated operation. These include system metrics such as CPU and memory usage, network io, and sampled profiling data.
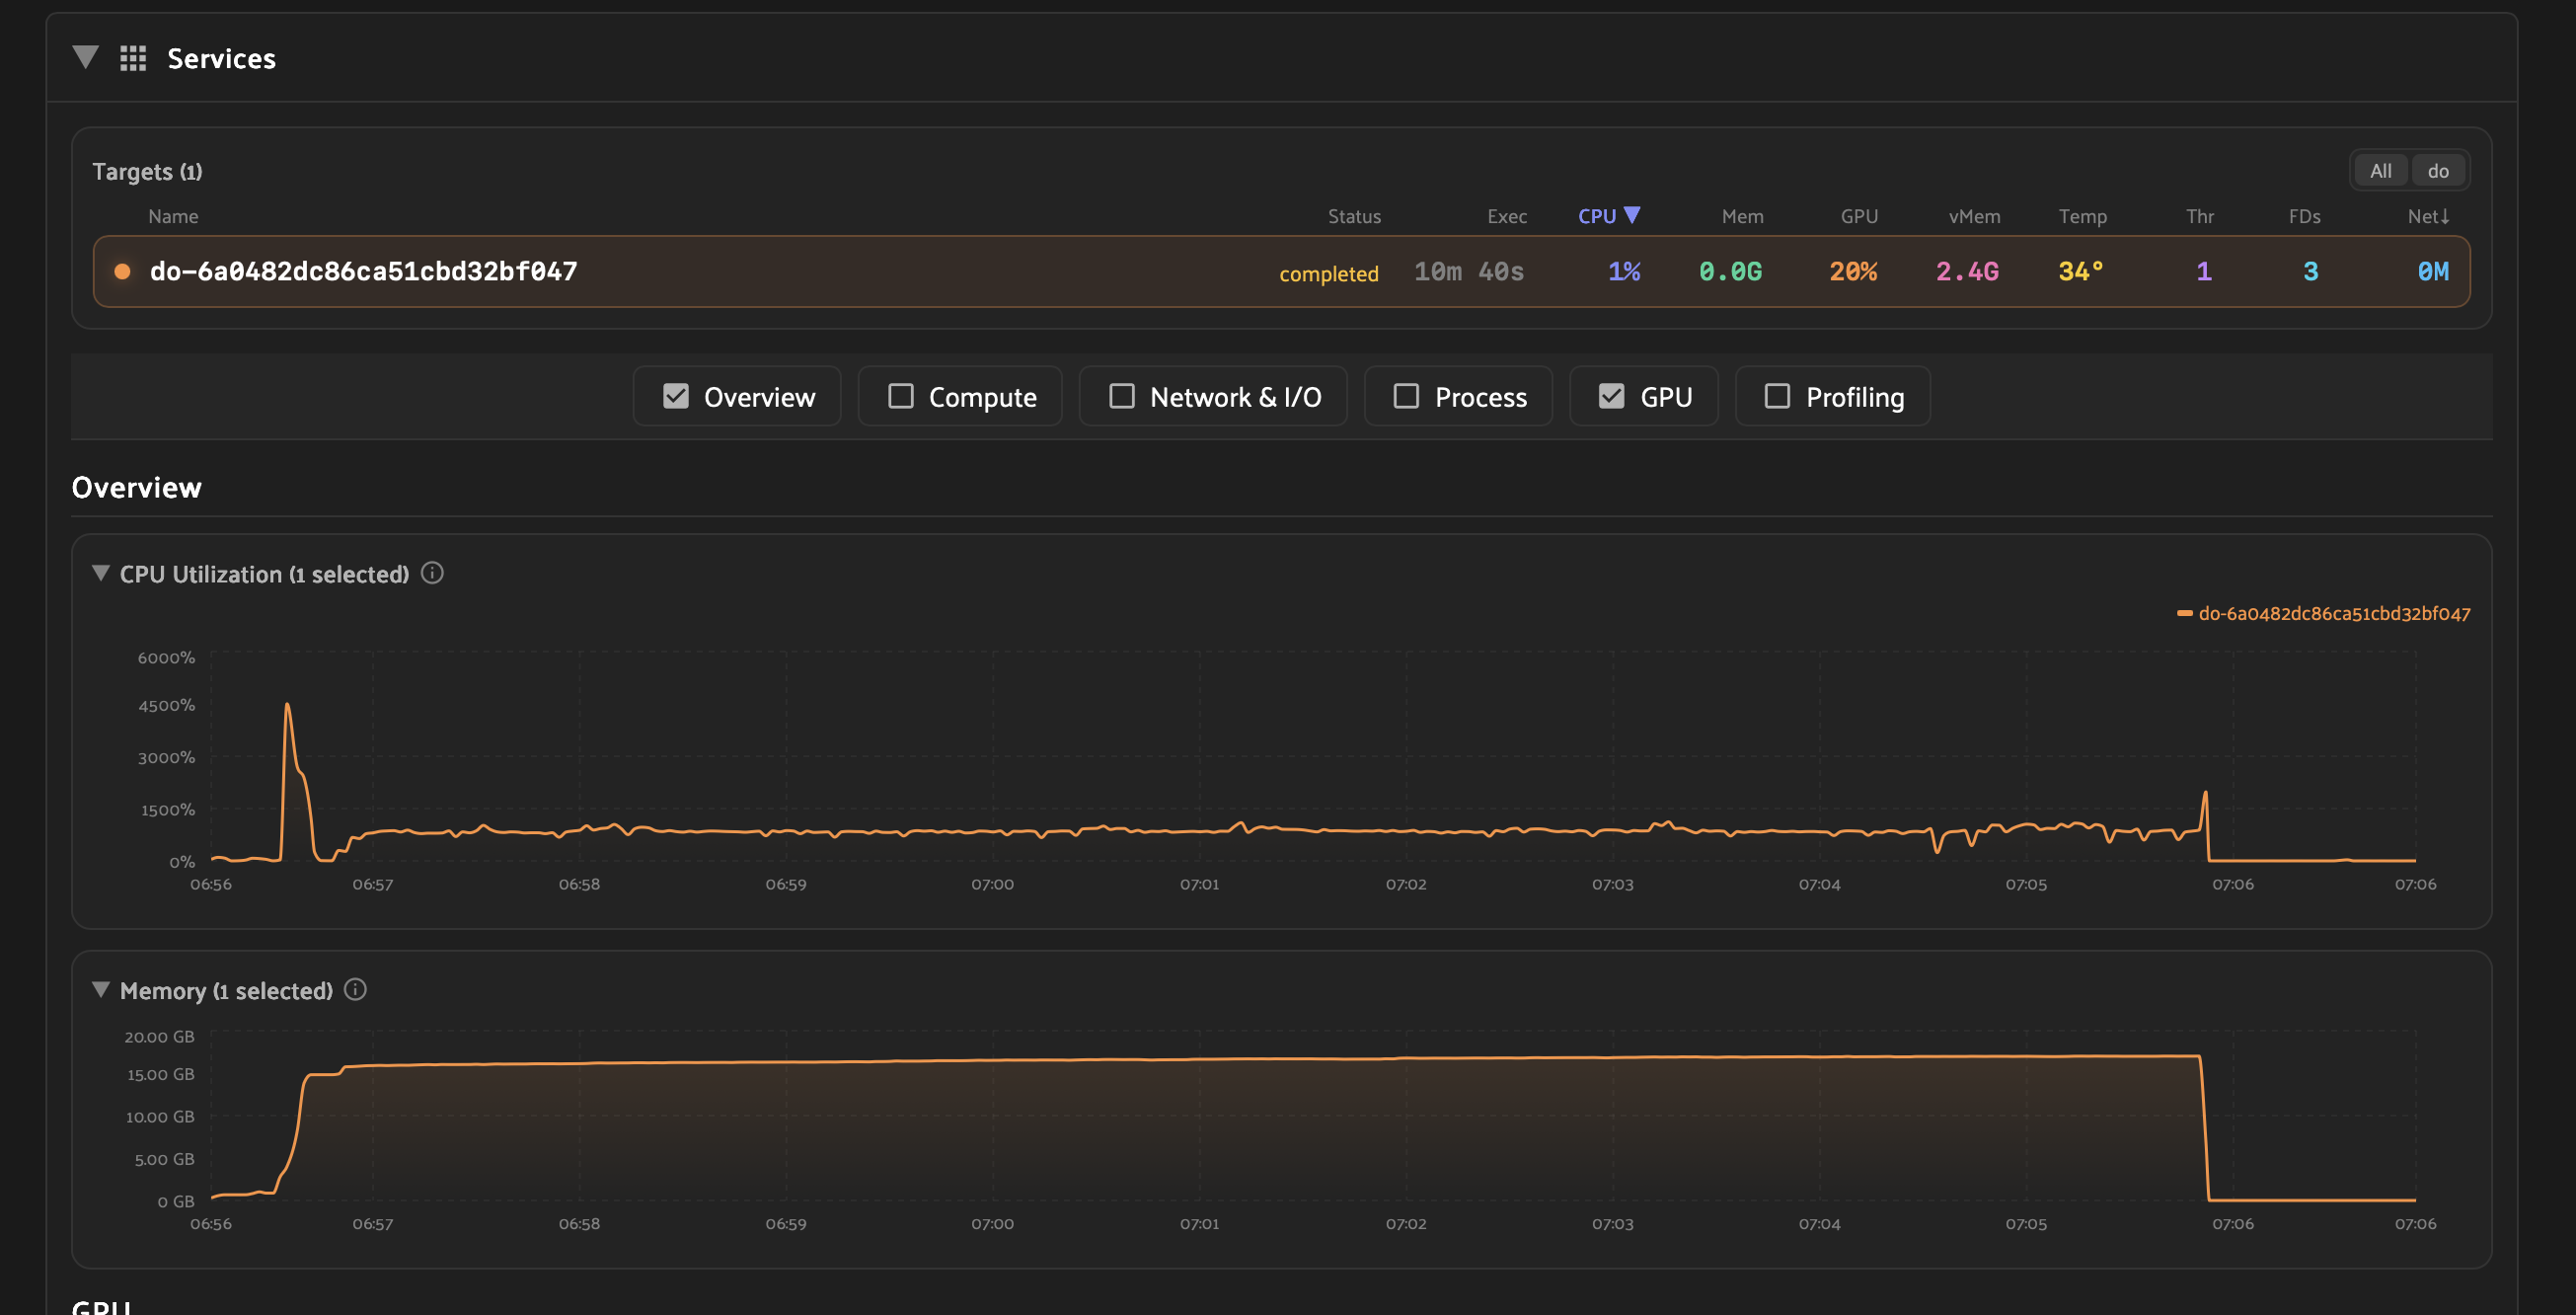
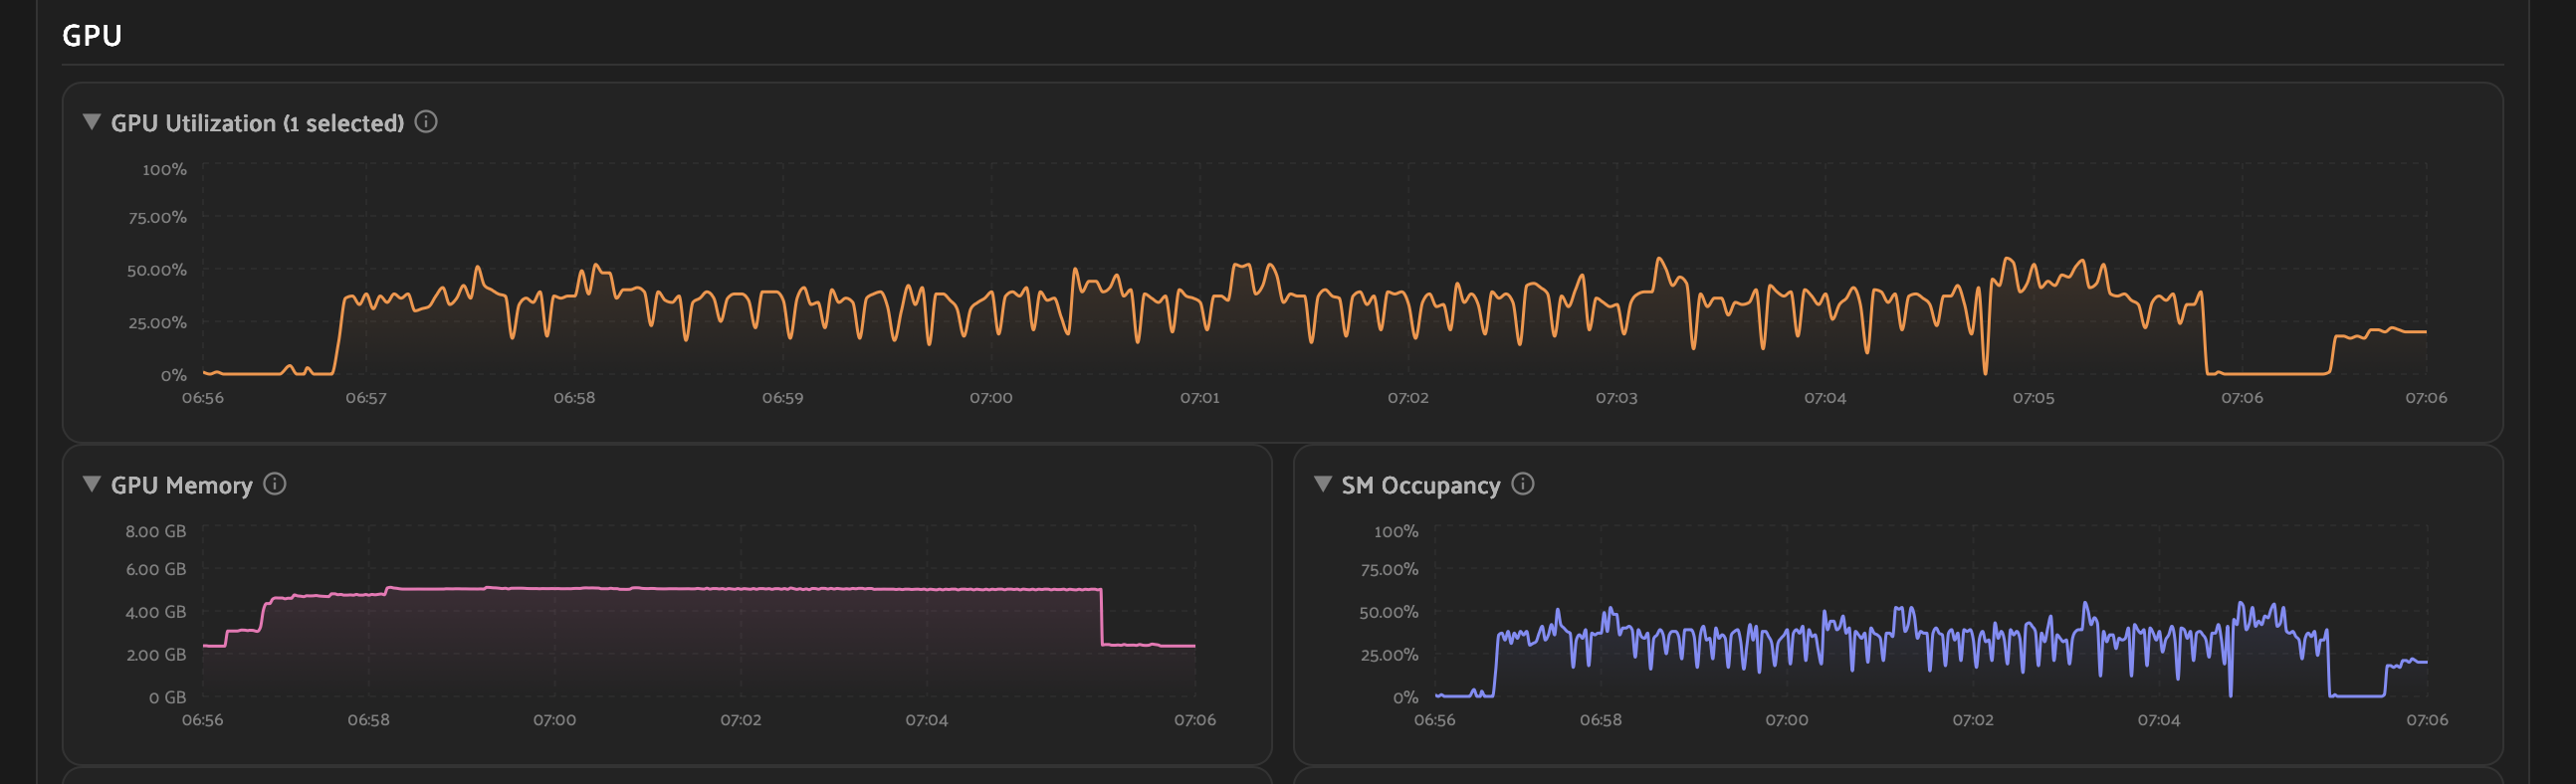
If the run was executed on a gpu-enabled cluster, you can also see gpu-specific metrics such as gpu utilization and gpu memory usage.
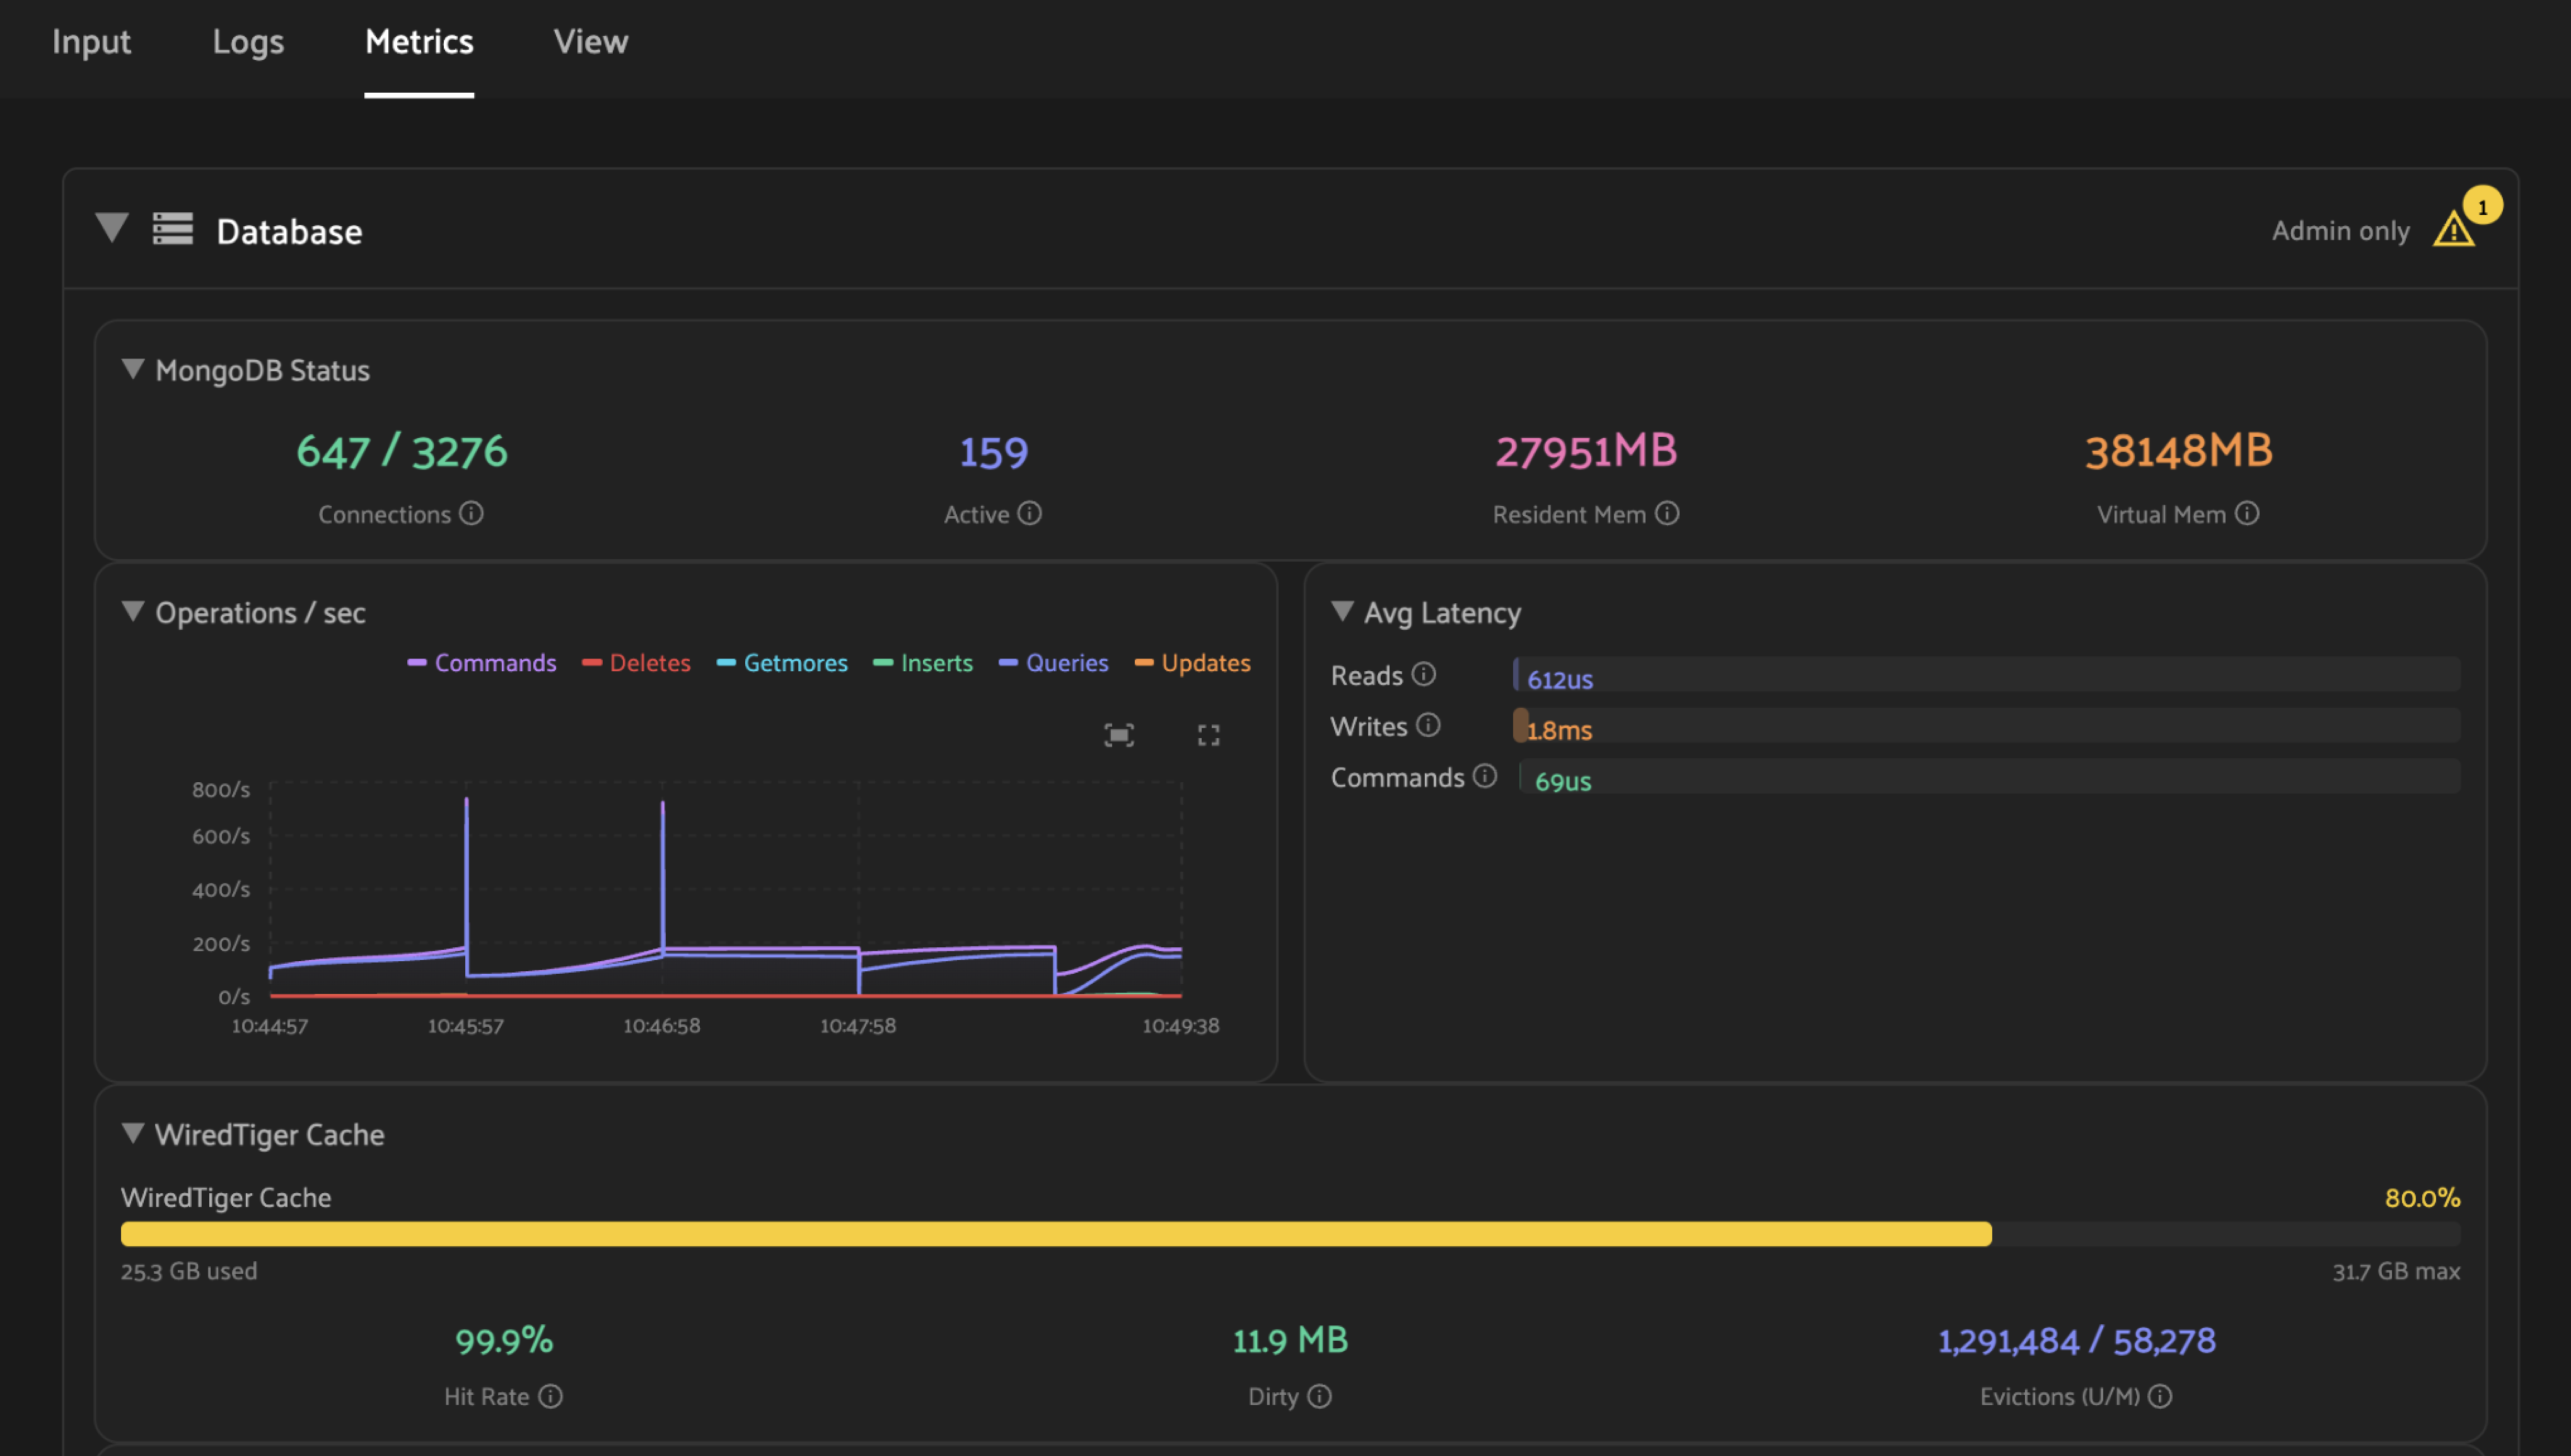
While an operation is running, admins also have access to a Database panel that allows them to monitor MongoDB system metrics and query performance in real time.
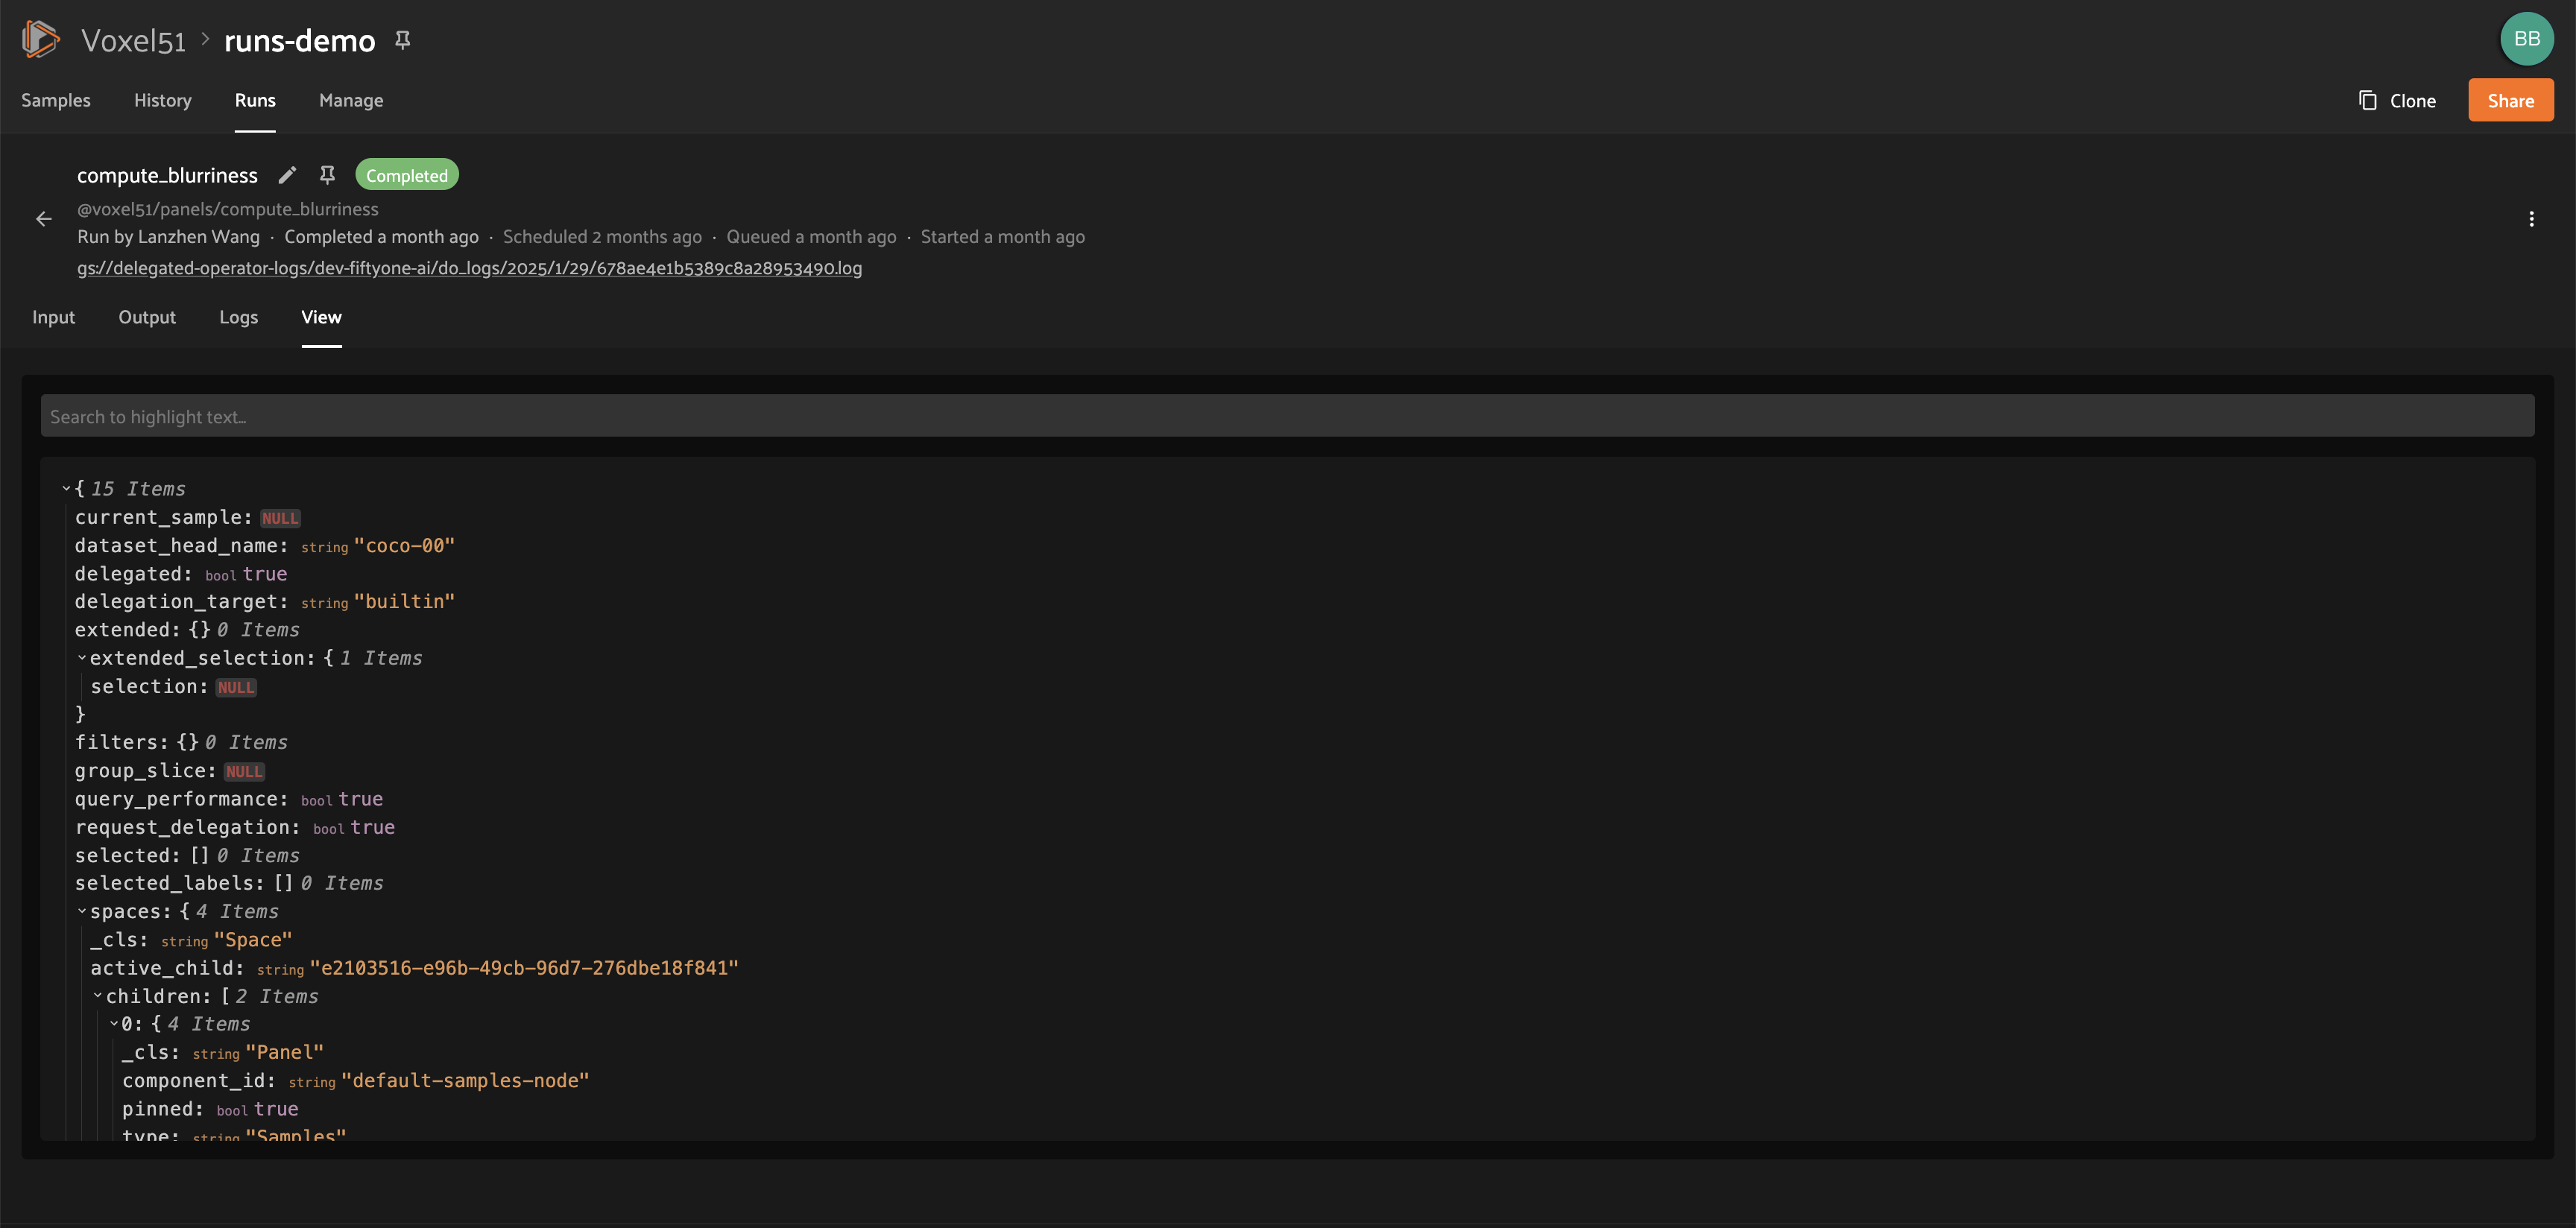
View#
The View tab on the Run page lets you see the specific view (which could be the full dataset) on which the operation was performed: