|
|
|
|
3D Visualization for Defect Inspection#
This notebook demonstrates how to integrate the MVTec 3D Anomaly Detection Dataset into FiftyOne. The dataset contains high-resolution 3D scans of objects, including point cloud data and RGB images, which are useful for anomaly detection tasks.
Learning Objectives:#
Convert TIFF to PCD format for visualization in FiftyOne.
Create a Grouped Dataset in FiftyOne
Leverage FiftyOne for visualization and analysis.
Key Features:#
3D Representation: The dataset provides XYZ point cloud representations stored as TIFF files.
RGB and Mask Images: Each sample includes an RGB image and a corresponding segmentation mask.
Anomalous and Normal Samples: The dataset includes both normal and defective objects for anomaly detection research.
Grouped Datasets in FiftyOne: FiftyOne supports the creation of grouped dataset which contain multiple modalities
To make this dataset compatible with FiftyOne, we need to convert TIFF files into PCD (Point Cloud Data) format for visualization.
Converting TIFF to PCD for Visualization#
MVTec 3D provides XYZ coordinate data stored in TIFF format, which must be converted to PCD format to be visualized in FiftyOne. The function below:
Loads the TIFF file as a NumPy array.
Reshapes it into Nx3 (XYZ points) format.
Saves it as a PCD file using Open3D.
Additionally, another function includes color segmentation from masks to highlight anomalies.
The next three cells are for your reference, so you can take a look at how to convert from TIFF to PCD.
[ ]:
# Before starting, install the following libraries in this environment
!pip install open3d
For the TIFF example, please select one sample from the MVTec 3D-AD dataset.
[ ]:
import os
import fiftyone as fo
import numpy as np
import open3d as o3d
import tifffile

def convert_tiff_xyz_to_pcd(tiff_path, pcd_path):
    # Load the TIFF as a NumPy array
    xyz_data = tifffile.imread(tiff_path)

    if xyz_data.ndim == 3 and xyz_data.shape[2] == 3:
        # If the data is in the shape (H, W, 3), reshape it to (H*W, 3)
        xyz_data = xyz_data.reshape(-1, 3)
    elif xyz_data.ndim == 2 and xyz_data.shape[1] == 3:
        # Already in Nx3 shape; no need to reshape
        pass
    else:
        raise ValueError(f"Unexpected TIFF shape {xyz_data.shape}; adapt code as needed.")

    # Create an Open3D point cloud from the reshaped data
    pcd = o3d.geometry.PointCloud()
    pcd.points = o3d.utility.Vector3dVector(xyz_data)

    # Save the point cloud to a .pcd file
    o3d.io.write_point_cloud(pcd_path, pcd)

# Example usage
convert_tiff_xyz_to_pcd("path/to/example.tiff", "path/to/colored_example.pcd")
[ ]:
import numpy as np
import open3d as o3d
import tifffile

def convert_tiff_xyz_to_pcd_with_color(tiff_path, mask_path, pcd_path):
    """
    Converts a .xyz TIFF file into a PCD file, adding color information from a mask.

    Assumes:
      - The TIFF file has shape (H, W, 3) and represents point coordinates.
      - The mask has shape (H, W) and is aligned with the TIFF data.

    Points corresponding to mask > 0 are colored red; others are colored light gray.
    """
    # Load the point coordinates from the TIFF and the segmentation mask
    xyz_data = tifffile.imread(tiff_path)
    mask = tifffile.imread(mask_path)

    # Ensure the shapes match spatially
    if xyz_data.ndim == 3 and xyz_data.shape[2] == 3:
        H, W, _ = xyz_data.shape
        if mask.shape[0] != H or mask.shape[1] != W:
            raise ValueError("The mask dimensions do not match the TIFF image dimensions.")
        # Flatten the point coordinates and mask to align one-to-one.
        points = xyz_data.reshape(-1, 3)
        mask_flat = mask.reshape(-1)
    else:
        raise ValueError(f"Unexpected TIFF shape {xyz_data.shape}; expected (H,W,3)")

    # Create a color array for each point.
    colors = np.zeros((points.shape[0], 3))
    # For example, assign red to segmented areas (mask > 0) and light gray elsewhere.
    colors[mask_flat > 0] = [1, 0, 0]      # Red for segmentation
    colors[mask_flat == 0] = [0.7, 0.7, 0.7] # Light gray for background

    # Create the Open3D point cloud and assign both points and colors.
    pcd = o3d.geometry.PointCloud()
    pcd.points = o3d.utility.Vector3dVector(points)
    pcd.colors = o3d.utility.Vector3dVector(colors)

    # Write the colored point cloud to the specified PCD file.
    o3d.io.write_point_cloud(pcd_path, pcd)

# Example usage:
convert_tiff_xyz_to_pcd_with_color("path/to/example.tiff", "path/to/example_mask.png", "path/to/colored_example.pcd")
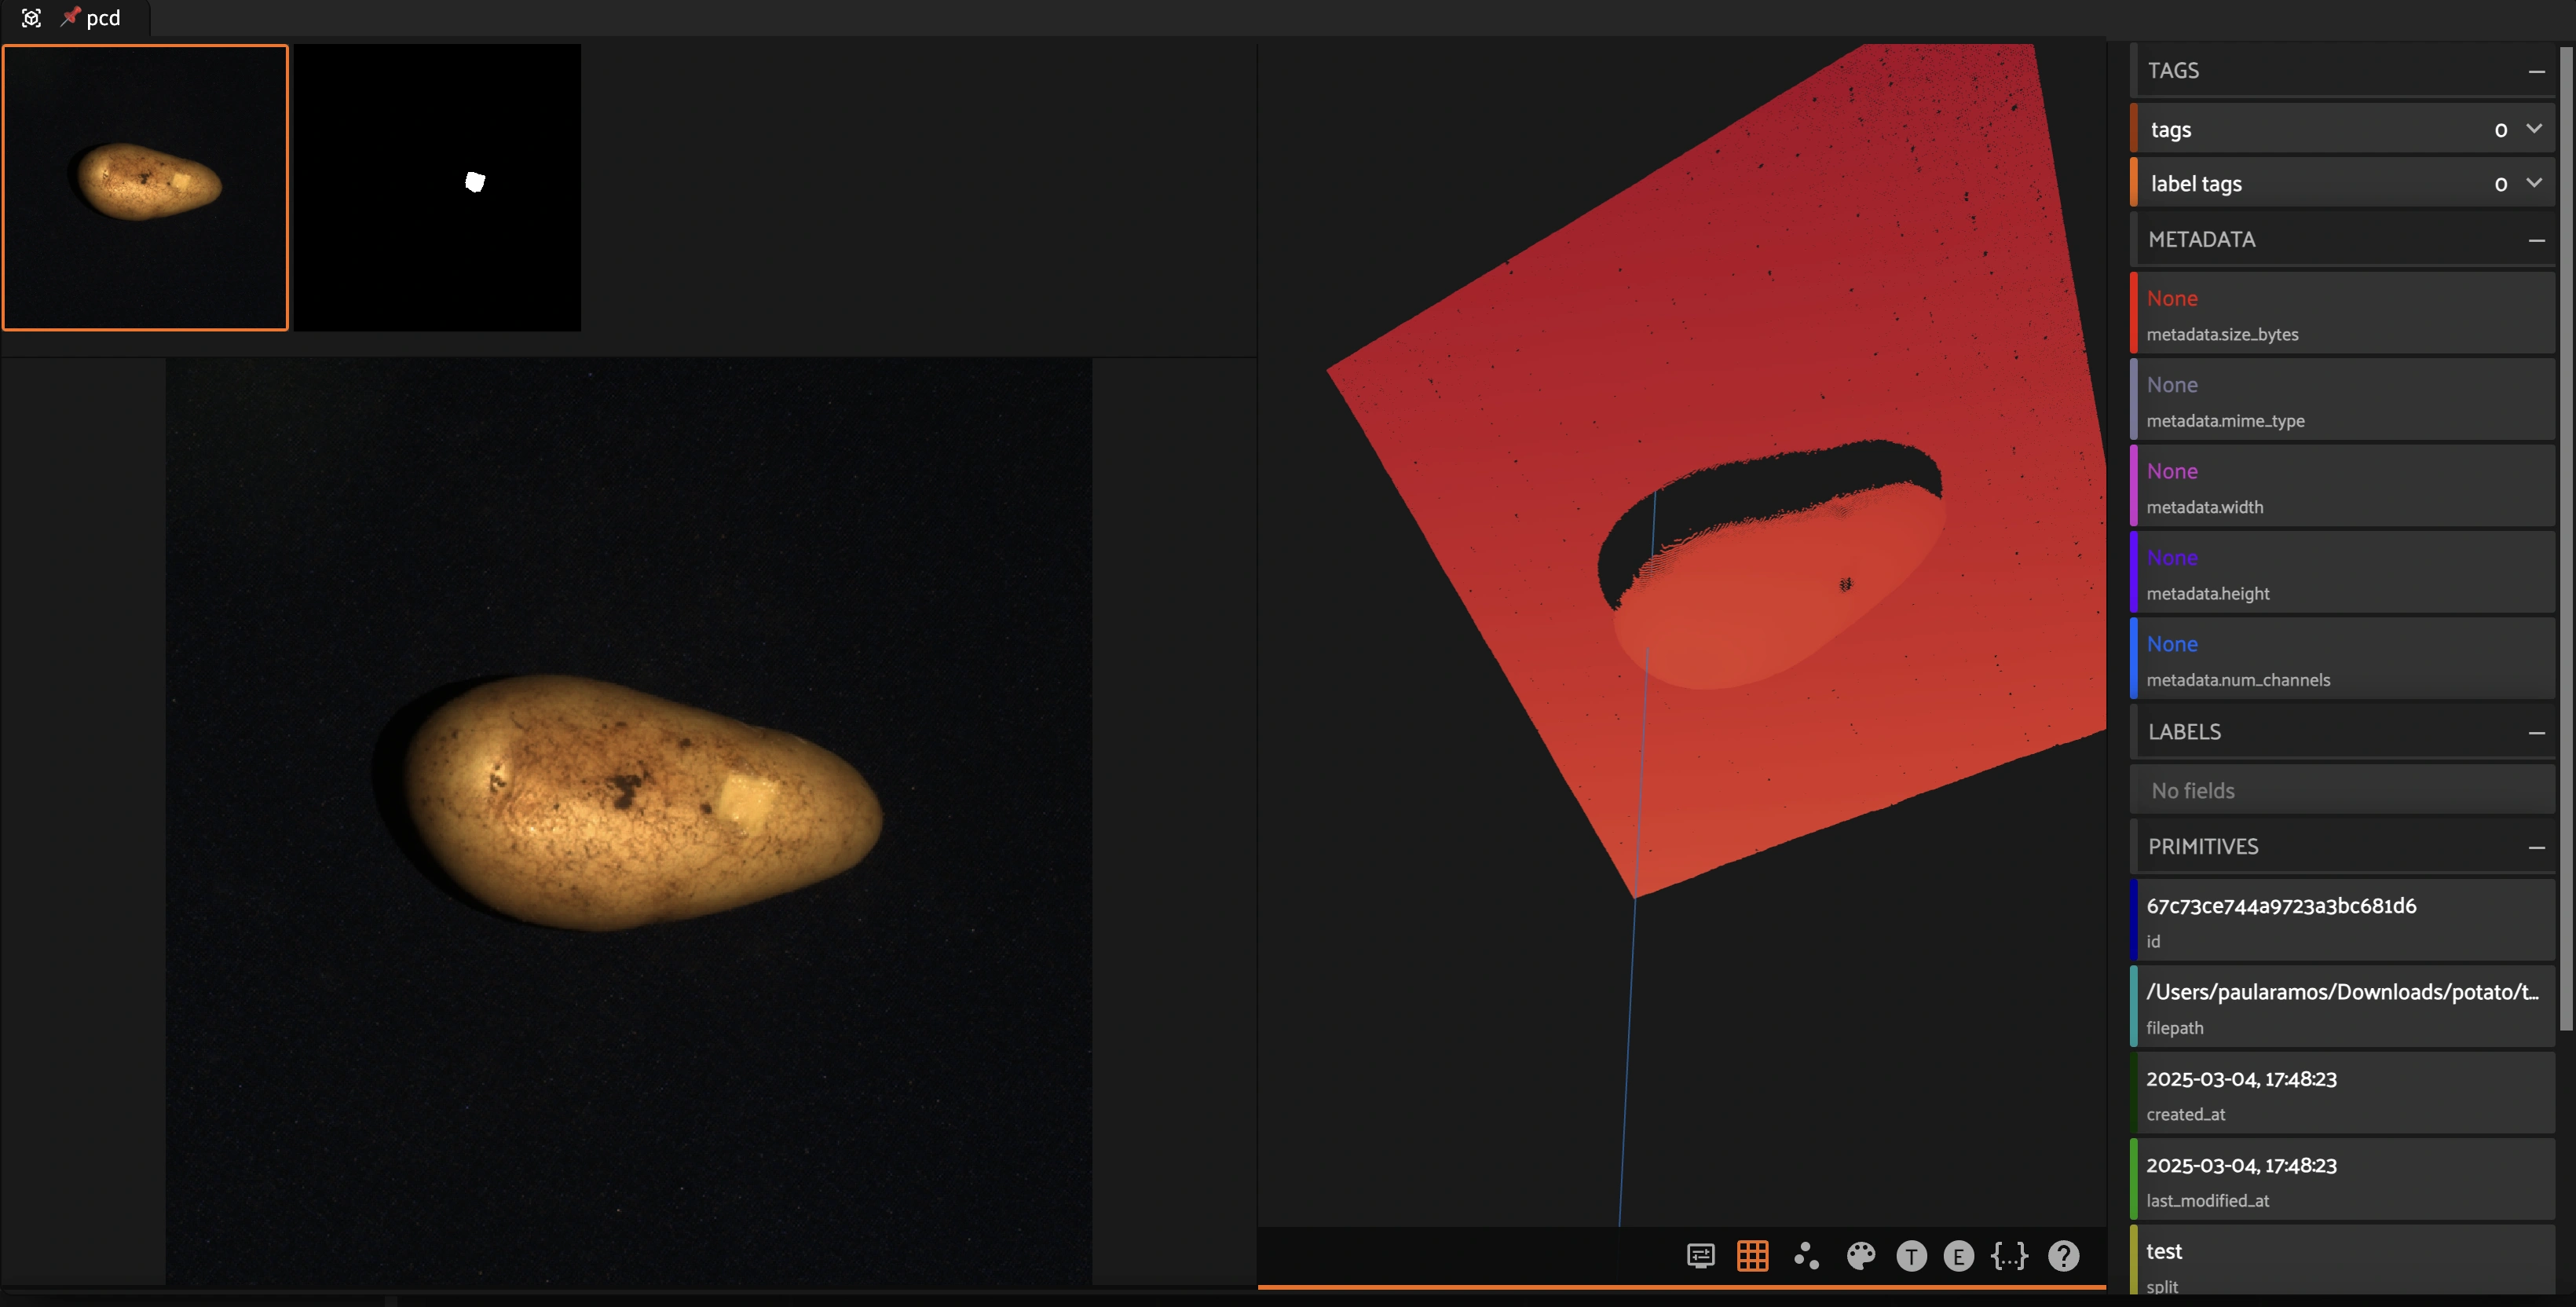
Creating a Grouped Dataset in FiftyOne#
FiftyOne allows creating grouped datasets, where multiple data modalities (e.g., RGB images, segmentation masks, and point clouds) can be linked together under a common identifier. This enables:
Synchronized visualization: Easily switch between different representations of the same object.
Multi-modal analysis: Combine insights from images, masks, and 3D data.
This notebook demonstrates how to create a grouped dataset where each sample includes:
An RGB image
A segmentation mask
A 3D point cloud (PCD)
We will use potato object from the MVTec 3D Dataset, here are the modified subset of the dataset.
You can download the subset here Potato MVTec 3D. Please download the dataset to disk and add samples in FiftyOne as I am showing you in the following cell.
Note: Loading this dataset using the Hugging Face hub won’t work because it is not saved in FiftyOne format.
Create the Dataset instance in FiftyOne#
[ ]:
import fiftyone as fo

# Create an empty dataset
dataset = fo.Dataset("potato_mvtec", persistent=True, overwrite=True)
Read the MVTec Directory (potato object) and creating pairs of metadata before grouping dataset in FiftyOne#
[ ]:
import os

def process_potato_folder(root):
    """
    Walks the directory tree under root (e.g. "potato") to create a list of dictionaries,
    each containing the paths for the rgb image, mask, and the existing PCD file.

    It extracts metadata from the folder structure (e.g. split and quality) and assigns a label:
      - "normal" if quality == "good"
      - "abnormal" otherwise.

    Assumes that the folder structure is as follows:

      potato/
          <split>/
              <quality>/   (e.g., "good" or "defective")
                  rgb/    <-- contains .png images
                  gt/     <-- contains corresponding mask .png images
                  pcd/    <-- contains pre-computed .pcd files
    """
    pairs = []
    # Walk the tree looking for "rgb" folders
    for dirpath, dirnames, filenames in os.walk(root):
        if os.path.basename(dirpath).lower() != "rgb":
            continue

        # Expected structure: .../<split>/<quality>/rgb
        quality_folder = os.path.basename(os.path.dirname(dirpath))
        split_folder = os.path.basename(os.path.dirname(os.path.dirname(dirpath)))
        print(f"Processing folder: {dirpath} (split: {split_folder}, quality: {quality_folder})")

        # Define corresponding folders for masks (gt) and PCD files (pcd)
        parent_dir = os.path.dirname(dirpath)
        gt_dir = os.path.join(parent_dir, "gt")
        pcd_dir = os.path.join(parent_dir, "pcd")
        print(f"Looking for PCD files in: {pcd_dir}")

        for file in filenames:
            if file.lower().endswith(".png"):
                base_name = os.path.splitext(file)[0]
                image_path = os.path.join(dirpath, file)
                mask_path = os.path.join(gt_dir, file)  # Assumes mask has same filename as image
                pcd_path = os.path.join(pcd_dir, base_name + ".pcd")

                # Check existence of required files
                image_exists = os.path.exists(image_path)
                mask_exists = os.path.exists(mask_path)
                pcd_exists = os.path.exists(pcd_path)

                if not (image_exists and mask_exists and pcd_exists):
                    print(f"Warning: Missing files for {base_name}: "
                          f"image({image_exists}), mask({mask_exists}), pcd({pcd_exists}). Skipping.")
                    continue

                # Determine overall label: "normal" if quality folder is "good", otherwise "abnormal"
                overall_label = "normal" if quality_folder.lower() == "good" else "abnormal"

                pair = {
                    "split": split_folder,
                    "quality": quality_folder,
                    "label": overall_label,
                    "image_path": image_path,
                    "mask_path": mask_path,
                    "pcd_path": pcd_path
                }
                pairs.append(pair)

    print(f"Total pairs processed: {len(pairs)}")
    return pairs

# Specify your root directory (e.g., the "potato" folder)
root_dir = "/path/to/your/dataset/root"
pairs = process_potato_folder(root_dir)

# Debug: print out the pairs list to verify paths and metadata
for pair in pairs:
    print(pair)
Creating the grouped dataset in FiftyOne#
[ ]:
samples = []
for idx, pair in enumerate(pairs):
    # Create a unique group id for this sample group
    group_id = f"sample_{idx}"
    group = fo.Group()

    # --- Image slice ---
    sample_image = fo.Sample(
        filepath=pair["image_path"],
        group=group.element("image")
    )
    sample_image["split"] = pair["split"]
    sample_image["quality"] = pair["quality"]
    sample_image["label"] = pair["label"]

    # --- Mask slice ---
    sample_mask = fo.Sample(
        filepath=pair["mask_path"],
        group=group.element("mask")
    )
    sample_mask["split"] = pair["split"]
    sample_mask["quality"] = pair["quality"]
    sample_mask["label"] = pair["label"]

    # --- Point Cloud slice ---
    sample_pcd = fo.Sample(
        filepath=pair["pcd_path"],
        group=group.element("pcd")
    )
    sample_pcd["split"] = pair["split"]
    sample_pcd["quality"] = pair["quality"]
    sample_pcd["label"] = pair["label"]

    # Add all three slices to the list
    samples.extend([sample_image, sample_mask, sample_pcd])

# Add the grouped samples to the dataset
dataset.add_samples(samples)
[ ]:
# Optionally, launch the FiftyOne App to inspect the dataset.
session = fo.launch_app(dataset, port=5157, auto=False)