
Annotation Workflows#
Workflows provide a flexible framework for orchestrating data operations across your team to bring humans into the loop. You define a multi-stage pipeline, run it over a dataset, assign work to members, and track progress one sample at a time. For example, in an annotate-and-review pipeline you build a workflow once, start it on a set of samples, and FiftyOne Enterprise routes each sample through the stages you defined to your annotation team until it is fully labeled and approved.
The Annotate Tab#
Workflows live in the Annotate tab of the FiftyOne Enterprise App within a dataset. Open the tab to see two areas:
My Tasks — work currently assigned to you, with a progress bar and a button to jump straight into labeling or reviewing.
Workflows — a grid of every workflow on the dataset showing its status, stage count, members, and overall completion.
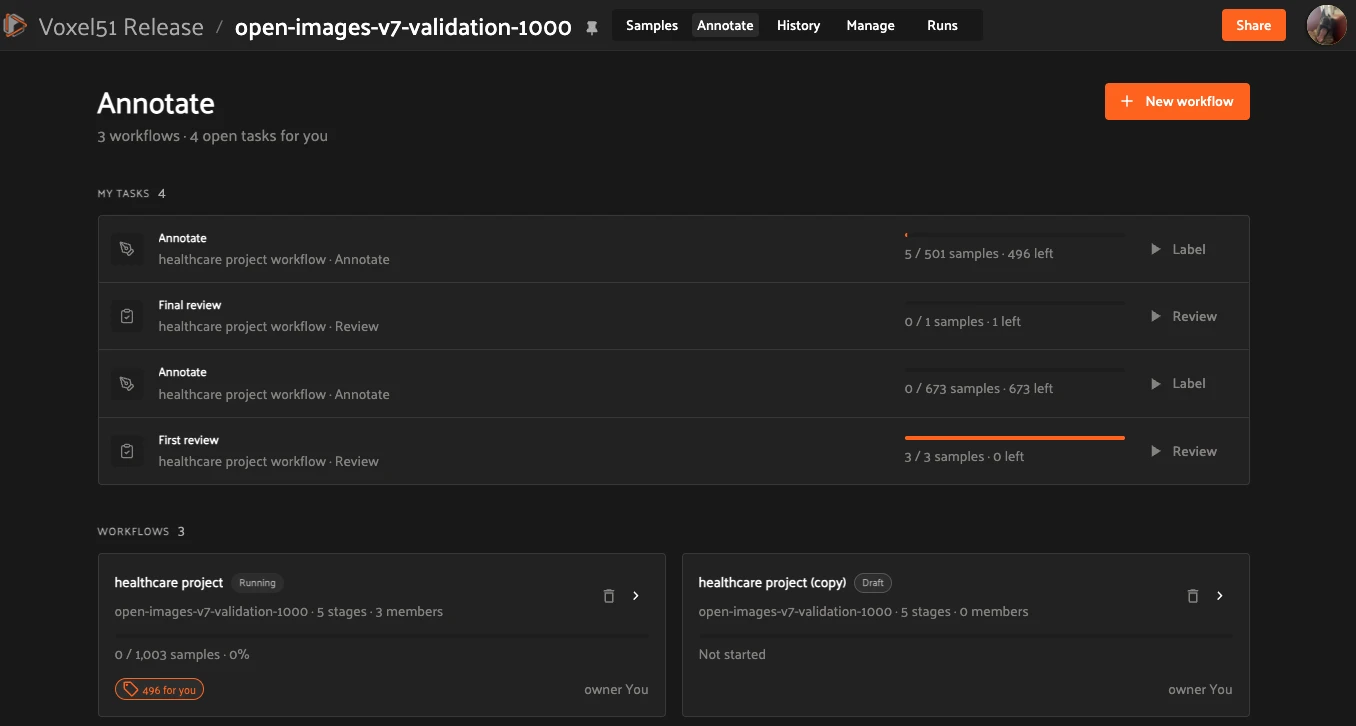
Each workflow has a status that reflects where it is in its lifecycle: Draft (still being designed), Started (launched, with tasks being created), Running (actively routing samples through its stages), or Complete (all samples have been fully processed).
Workflows are built from stages, each with stage-specific configuration options, that can spawn tasks and delegated operations. The core stage types are:
Input samples — a fixed first stage that defines which samples the workflow runs on.
Annotate — assignees label the samples that reach this stage and submit the samples as they finish.
Review — assignees approve or reject labeled samples. A review stage has two outgoing branches, Accepted and Rejected, that you wire to downstream stages.
A running workflow creates tasks — units of work assigned to members. Each member sees their share under My Tasks. Progress is tracked per unique sample: a stage’s total reflects the number of unique samples currently available to work on — this number updates as upstream stages push new samples in.
How to: Create a Workflow#
Click + New workflow in the Annotate tab to open the workflow editor.
Building the Pipeline on the Canvas#
The editor is a visual node graph. Each stage is a node; drag from one stage’s output handle to the next stage’s input handle to create a connection.
For a Review stage, wire the Accepted output forward (for example, to a final review or to the end of the pipeline) and the Rejected output back to an Annotate stage so the sample is fixed and resubmitted.
The canvas toolbar provides:
Tidy — auto-layout the graph.
Clear — reset the pipeline.
Delete — remove the selected stage.
Start workflow — launch the workflow once it is configured.

Using a Template#
Instead of building from scratch, click Templates to start from a prebuilt pipeline. Templates are a fast way to stand up common annotate-and-review patterns; customize the stages after importing.
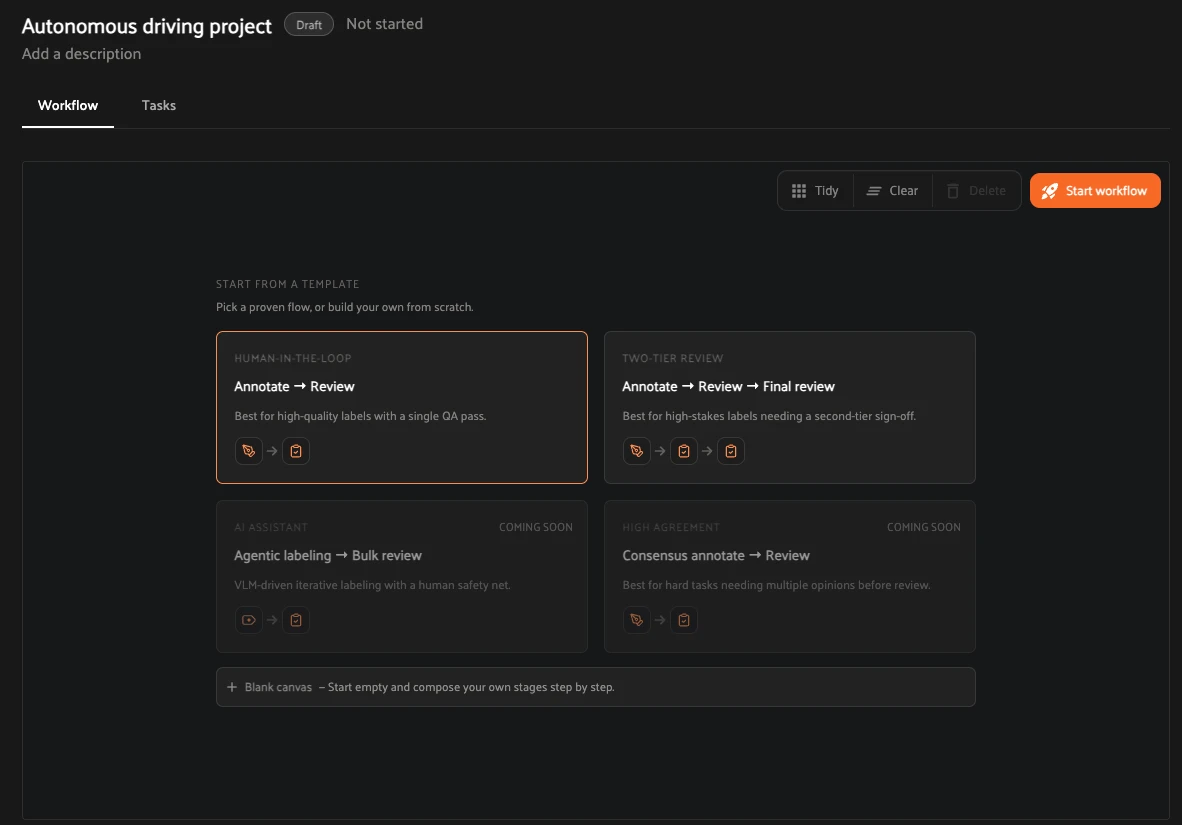
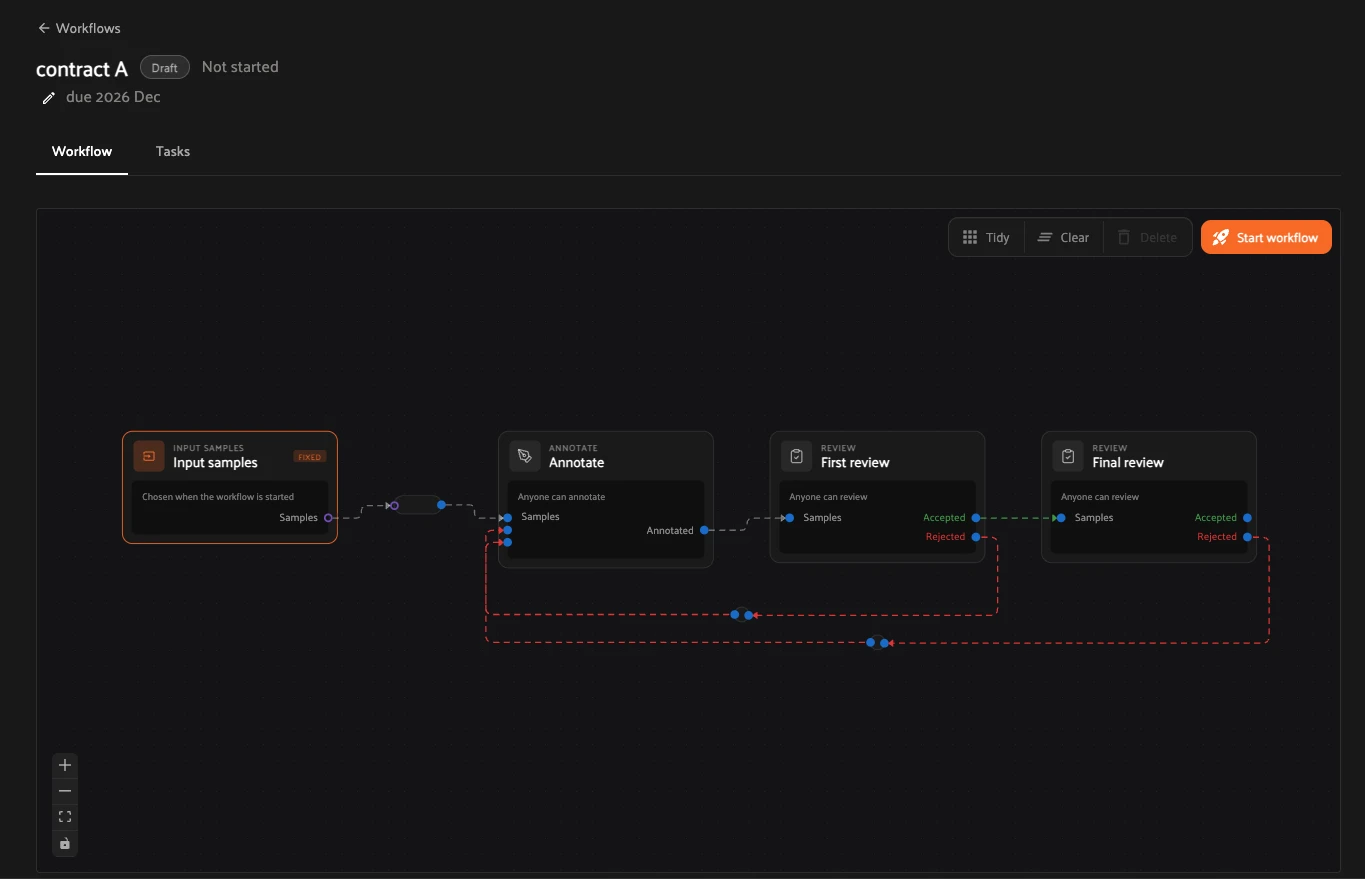
For example, the Human-in-the-loop template creates a single Annotate → Review pipeline:
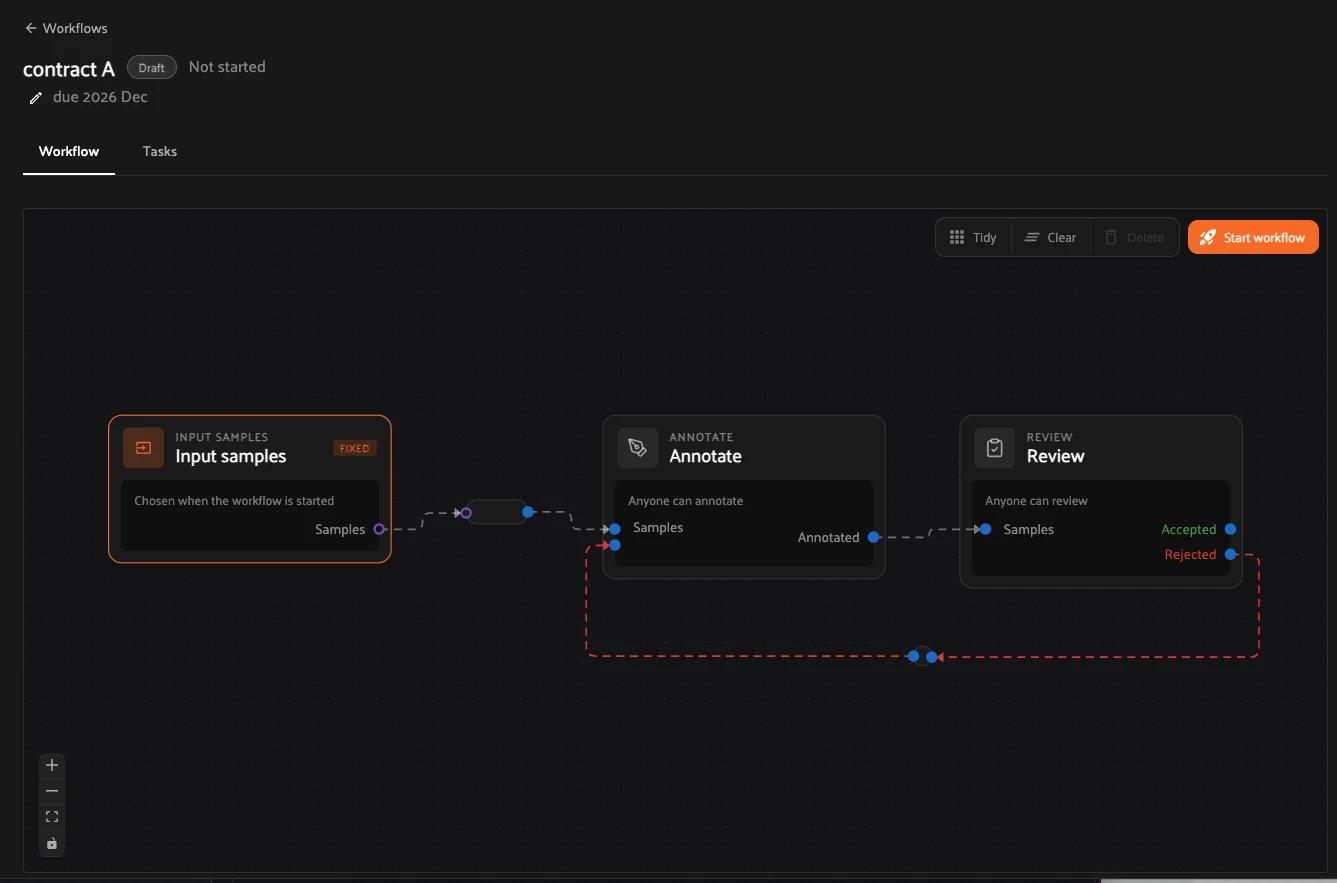
The Two-tier review template adds a second review stage for high-stakes labeling:
Configuring Stages#
Click a stage on the canvas to configure it.
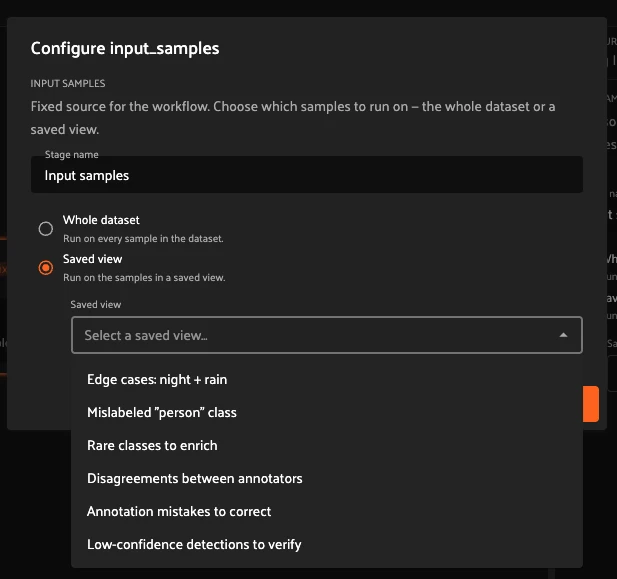
For example, the Input samples stage lets you choose which samples enter the pipeline, such as a saved view:

An Annotate or Review stage lets you set who is assigned to the work. The following example shows how to edit the assignee for a Review stage:
Starting a Workflow#

When the pipeline is ready, click Start workflow. The workflow moves from Draft to Running, tasks are created for each member, and a “N for you” indicator appears on the workflow card in the Annotate tab.
Cloning and Deleting#
Clone a workflow to reuse its pipeline as the starting point for a new one.
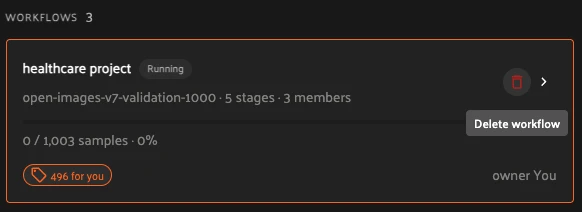
Delete a workflow you no longer need from the workflow card or the detail view.
Viewing Tasks#
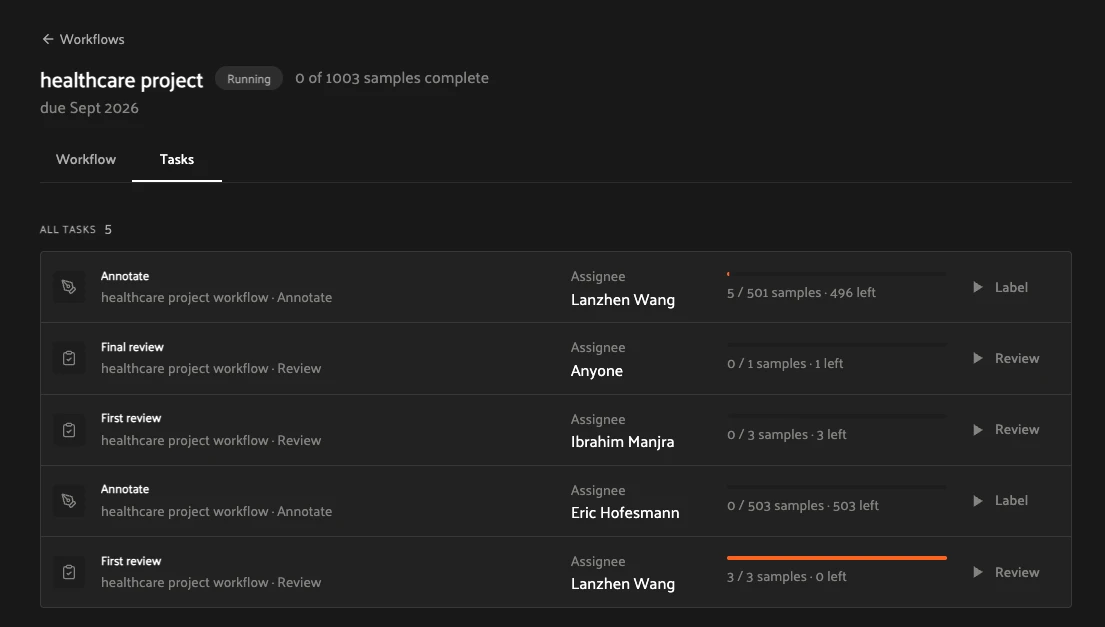
Each workflow has a Tasks tab listing every task the workflow has generated, so you can see work across the whole pipeline in one place.
How to: Work on Tasks#

Open the Annotate tab and pick a task from My Tasks. Annotate tasks open in labeling mode; review tasks open in review mode.
Task Mode#
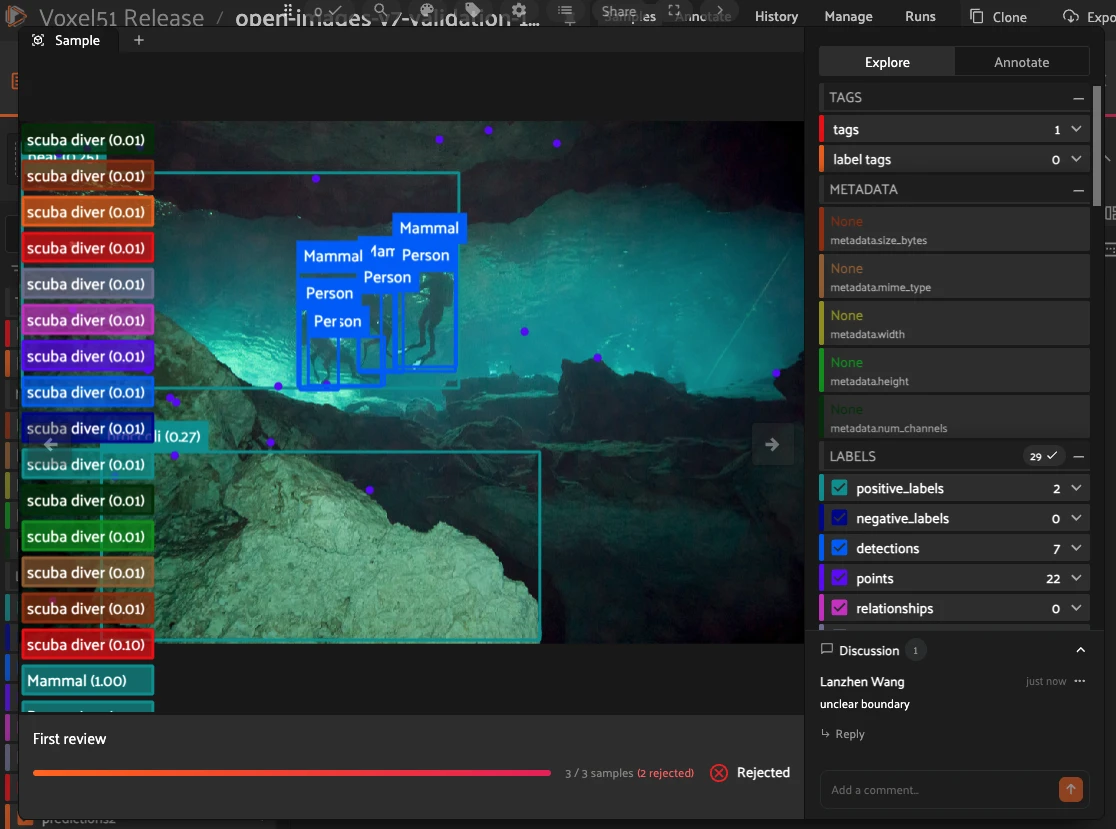
When you open a sample as part of a task, the sample modal adds two surfaces alongside the usual viewer:
Task banner. Displays task progress at a glance, along with a Resume labeling button to jump back into the task and a link to View workflow for the full pipeline context.

Task progress. Shows how many samples have been completed out of the total assigned to the task (for example, “5 / 501 samples”).

Annotate#
In an annotate task you label one sample at a time. Click Submit & next to save your work and advance, or Skip to move on without labeling (the sample stays pending until someone completes it). The progress indicator (for example, “5 / 501 samples · 496 left”) tracks how many samples remain.
Review#
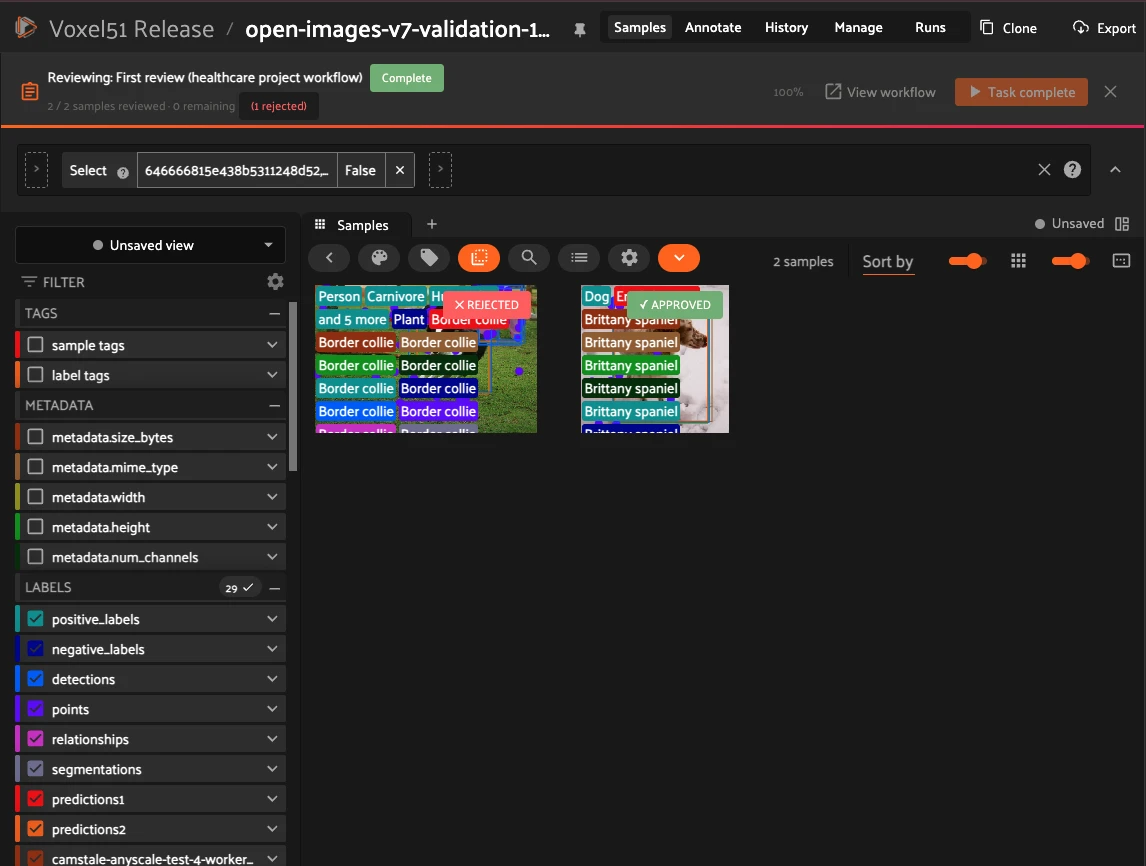
In a review task you approve or reject labeled samples. Each sample is marked with an APPROVED or REJECTED badge. Approving or rejecting samples routes them to the next stage as defined in the workflow pipeline; for example, rejecting a sample might route it back to the annotate stage it came from. The task progress (for example, “2 / 2 samples reviewed · 0 remaining (1 rejected)”) reflects outcomes, and you complete the task with Task complete once all samples have been reviewed.
Use the discussion tray to leave comments on individual samples to flag issues to your teammates.
Leaving Comments#
While reviewing, you can leave comments on individual samples to flag issues, request changes, or discuss specific labels with the annotator. Comments stay attached to the sample so the conversation follows the work as it moves through the pipeline.
How to: Understand Metrics#
Each workflow has a Metrics tab that answers the question “how is this work going?” — how much has been produced, by whom, at what quality, and at what pace. The numbers are built from the same submissions and review decisions your team makes while working on tasks.

Note
Metrics are powered by activity tracking, which must be enabled on your deployment. If the board stays empty while work is clearly happening, contact your admin.
Choosing a Scope#
The selector in the top-left corner controls how much work the board aggregates:
This workflow — only the workflow you are viewing.
This dataset — every workflow on this dataset that you have access to.
All datasets — every workflow across all datasets that you have access to.
The stage filter next to it adapts to the scope. Within This workflow you can drill into any individual stage of the pipeline — for example, Annotate, First review, and Final review in a two-tier pipeline. In the two aggregated scopes, stages combine by type instead: All stages, Annotate, or Review.

Reading the Board#
The chart plots the selected Metric (for example, Labels / day) over the selected Period, with the total and per-day average summarized in the corner. Below it, four cards summarize the scope:
Labels submitted — labels included in submitted samples, net of deletions.
Samples submitted — unique samples submitted.
Avg time / label — active working time divided by labels submitted; shows a dash when the scope contains no labels (or no tracked time) yet.
Active people — how many people did work in the current scope and period.
The board syncs periodically — the “Synced …” timestamp in the toolbar shows how fresh the numbers are, and the refresh button pulls the latest.
The Per-Person Table#
Below the cards, one row per person per assigned stage breaks the same numbers down. Rows measure throughput: an annotator’s submissions and a reviewer’s decisions both count as work, so someone who annotates in one stage and reviews in another appears once per role.
Alongside the volume columns (Samples, Labels touched, Added, Deleted, Modified) and pace columns (Total time, Avg time / sample, Trend), a row carries two quality columns — First-pass approval and Rejection rate — reflecting how the work that person shipped from that stage fared in later review: an annotator’s submissions, or, in pipelines where one review follows another, a reviewer’s approvals (see Who Reviews What in Longer Pipelines below). Use the Columns menu to choose which columns are shown. A dash means the value is not available yet — for example, an annotator none of whose submissions has been reviewed.

Quality: First-Pass Approval and Rejection Rate#
First-pass approval rate — of the submissions that have been reviewed at least once, the fraction whose first review decision was an approval. It answers “how often is this work right the first time?” — later re-reviews never change it.
Rejection rate — of all review decisions made on the work, the fraction that were rejections. It is cumulative: every decision counts, including re-reviews of reworked samples, so it falls as fixed work gets approved.
Both rates ignore pending work: submissions that nobody has reviewed yet sit outside the denominator entirely rather than dragging the rate down.
A worked example: an annotator submits 3 samples, and a reviewer approves 2 and rejects 1:
First-pass approval: 2 of 3 first decisions were approvals — 67%.
Rejection rate: 1 of 3 decisions was a rejection — 33%.
The rejected sample is then reworked, resubmitted, and approved:
First-pass approval stays 67% — that sample’s first decision was still a rejection, and first decisions are a permanent record.
Rejection rate falls to 25% — 1 rejection out of 4 total decisions.
Who Reviews What in Longer Pipelines#
In a pipeline with several annotate and review stages, each review stage judges the work that reaches it — and a reviewer’s own approvals can be judged by a later review in turn. Consider a six-stage pipeline:
Annotate 1 → Annotate 2 → Review 1 → Annotate 3 → Review 2 → Review 3
Review 1 is the first review after Annotate 1 and Annotate 2, so its decisions judge the combined work of both stages — each label counts toward the person who authored it.
Review 2 judges the new work from Annotate 3.
Review 3 follows another review directly, so it re-judges what passed Review 2: its decisions reflect on Annotate 3’s labels and on Review 2’s approvals.
When Review 3 rejects a sample that Review 2 approved, the rejection counts against Review 2’s row as well — which is why a review stage can itself show a rejection rate. This is how a two-tier review pipeline surfaces reviewer quality, not just annotator quality.
How Time Is Measured#
All time metrics — Total time, Avg time / label, and Avg time / sample — are built from active working time, measured in the browser while a person has a sample open as part of a task:
Presence is inferred from input. Pointer, keyboard, wheel, and touch activity mark you as present. Short pauses between inputs count in full — reading and inspecting a sample is work — but once a pause reaches a minute with no input, the clock rewinds to the last moment of activity and stops. Stepping away never inflates the numbers.
Hidden tabs never count. Switching to another tab or window stops the clock immediately; returning to the tab restarts it.
Time follows the sample and the role. Working time is credited to the specific sample being worked on and to the stage where the work happens, so annotate time and review time are tracked separately — the same person shows separate times in an Annotate row and a Review row.
A dash means no measurable time. Time metrics show a dash rather than a zero when there is no tracked active time in the selected scope.
What Counts (and What Doesn’t)#
Only submitted work counts. Labels edited but never submitted stay off the board.
Labels are counted net of deletions: a label added and then deleted before submitting nets to zero.
A sample approved with no labels counts as a submitted sample with zero labels — the board reads Samples 1 / Labels 0, not nothing.
Skip is not a submission.
Rates never punish waiting: one reviewed-and-approved submission with ten more still pending reads 100% first-pass approval, not 9%.