|
|
|
|
Quickstart: In-App Labeling in 15 Minutes#
This quickstart shows you how to annotate a multimodal 2D/3D dataset directly in the FiftyOne App. By the end, you’ll know:
How grouped datasets work (synchronized 2D + 3D data)
How to switch between camera and point cloud views
How to draw 2D bounding boxes on images
How to explore 3D point cloud data
Note: This track is standalone. The Full Loop track uses a cloned dataset (
annotation_tutorial) so you can do both independently.
Setup#
[ ]:
!pip install -U fiftyone
[ ]:
import fiftyone as fo
import fiftyone.zoo as foz
from fiftyone import ViewField as F
Load the Multimodal Dataset#
We’ll use quickstart-groups, a subset of the KITTI self-driving dataset with:
Left camera images (2D)
Right camera images (stereo pair)
Point cloud data (3D LiDAR)
All synchronized per scene.
[ ]:
# Load directly from the zoo (changes are ephemeral)
dataset = foz.load_zoo_dataset("quickstart-groups")

print(f"Dataset: {dataset.name}")
print(f"Media type: {dataset.media_type}")
print(f"Group slices: {dataset.group_slices}")
print(f"Default slice: {dataset.default_group_slice}")
print(f"Num groups (scenes): {len(dataset.distinct('group.id'))}")
Understand the Grouped Structure#
A grouped dataset links related samples together. Each group represents one scene with multiple views:
Slice |
Content |
What you’ll see |
|---|---|---|
|
Left camera image |
2D RGB image with existing detections |
|
Right camera image |
Stereo pair |
|
Point cloud |
3D LiDAR visualization |
[ ]:
# Look at one group
group_ids = dataset.distinct("group.id")
print(f"Total groups (scenes): {len(group_ids)}")

# Examine first group
example_group = dataset.get_group(group_ids[0])
print(f"\nSamples in first group:")
for slice_name, sample in example_group.items():
    print(f"  {slice_name}: {sample.filepath.split('/')[-1]}")
Launch the App#
[ ]:
session = fo.launch_app(dataset)
Explore the Grouped Data#
In the App, you will notice the group icon in the grid. Each cell represents a group (scene) with multiple slices.
Click on any sample to open the expanded view
Click the Annotate tab (right sidebar)
Use the Annotating Slice dropdown to switch between
left(camera),right(camera), andpcd(point cloud)
Try switching to pcd to see the 3D point cloud visualization.
Enter Annotate Mode (2D)#
Let’s label some objects on the camera images:
Click on a sample to open the modal
Select the ``left`` slice (camera view)
Click the “Annotate” tab (pencil icon in the right sidebar)
You’re now in annotation mode.
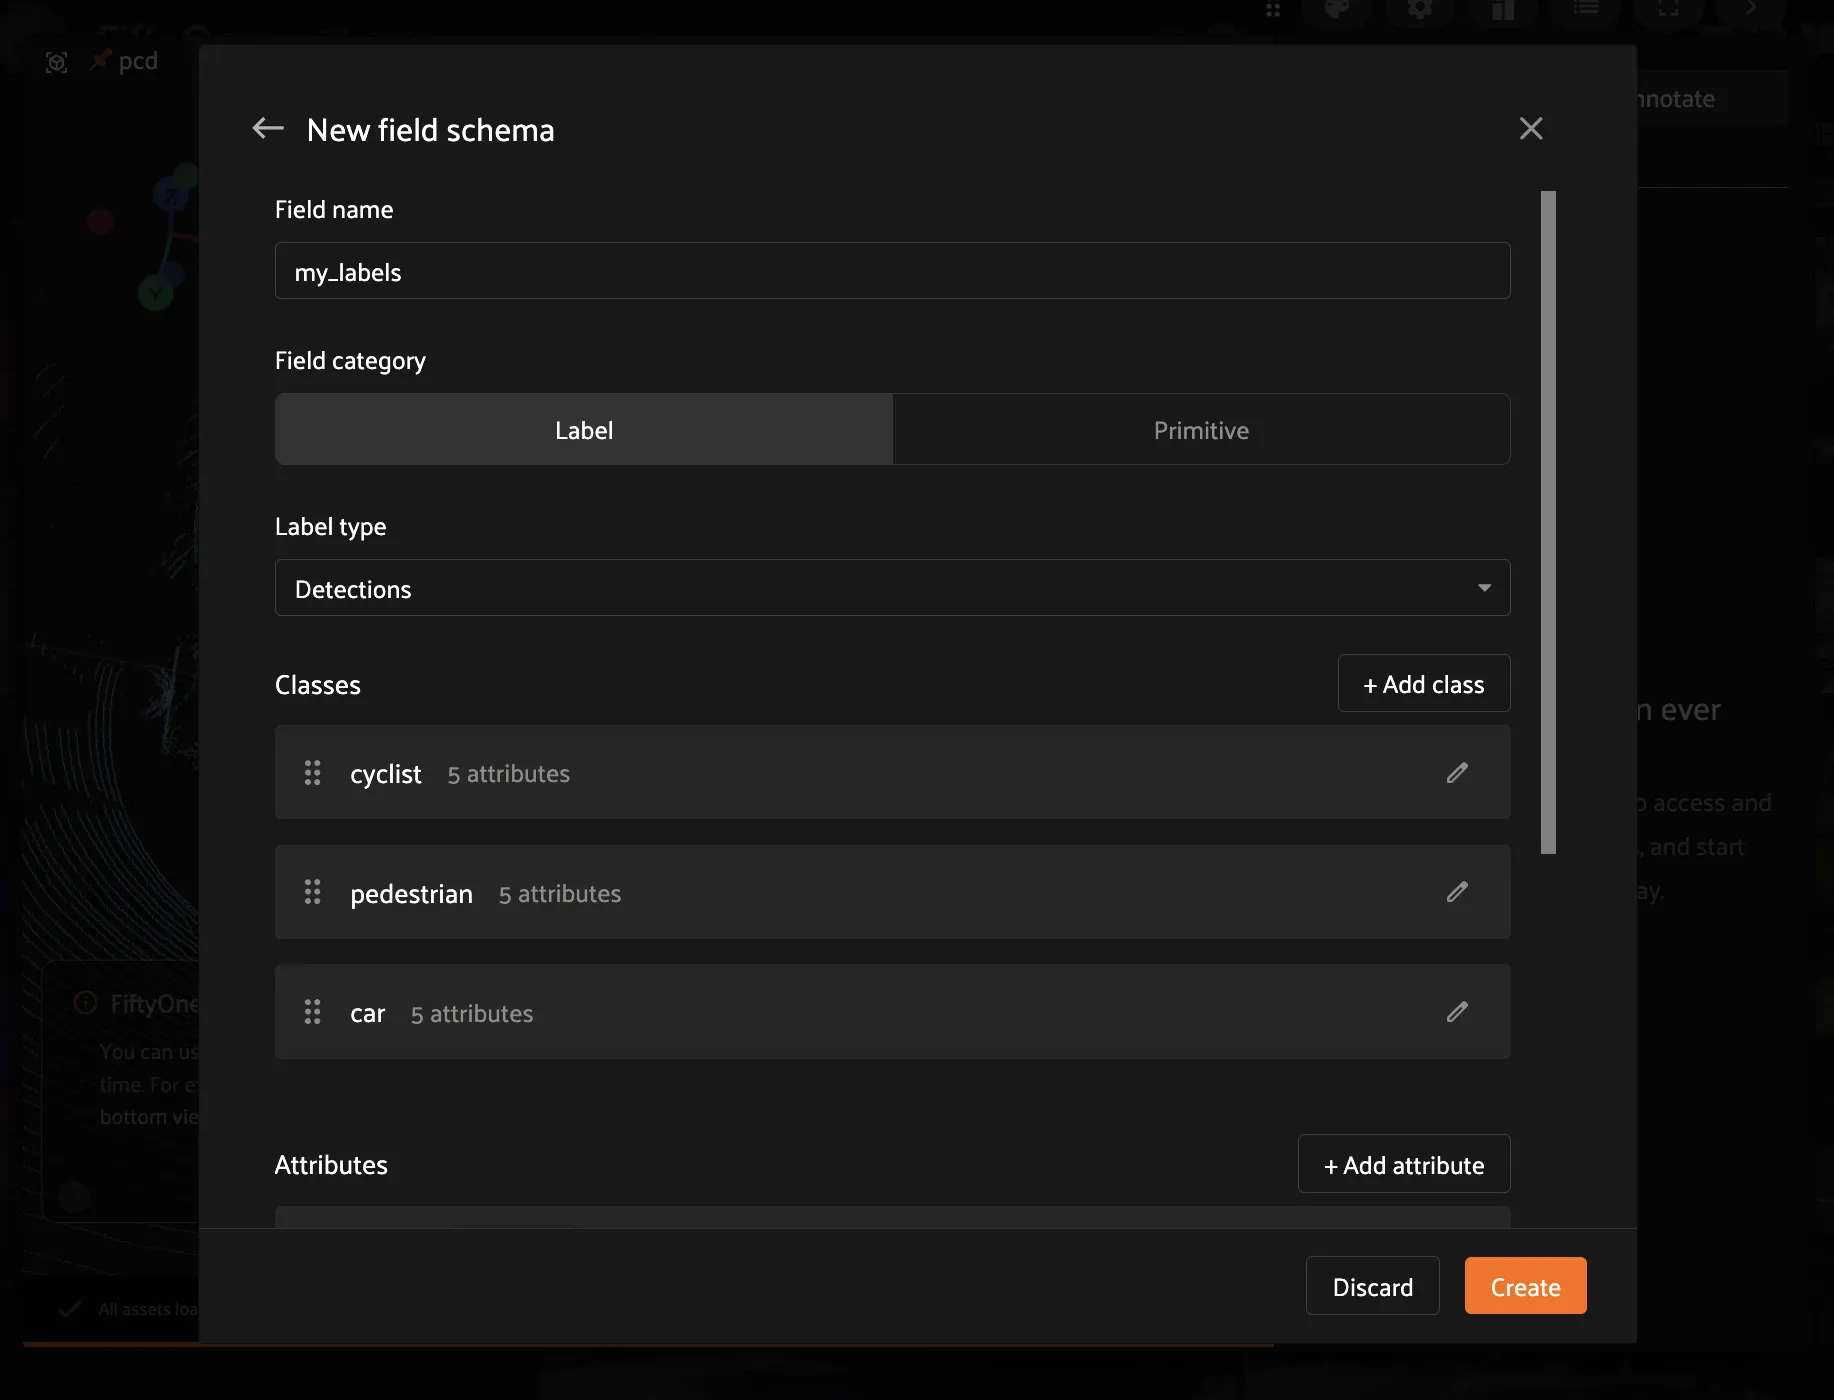
Create a Label Field#
Before drawing boxes, create a field to store them:
In Annotate mode, click the Add schema button
Click “New Field”
Enter name:
my_labelsSelect type: Detections (bounding boxes)
Add classes:
Car,Pedestrian,CyclistClick Create
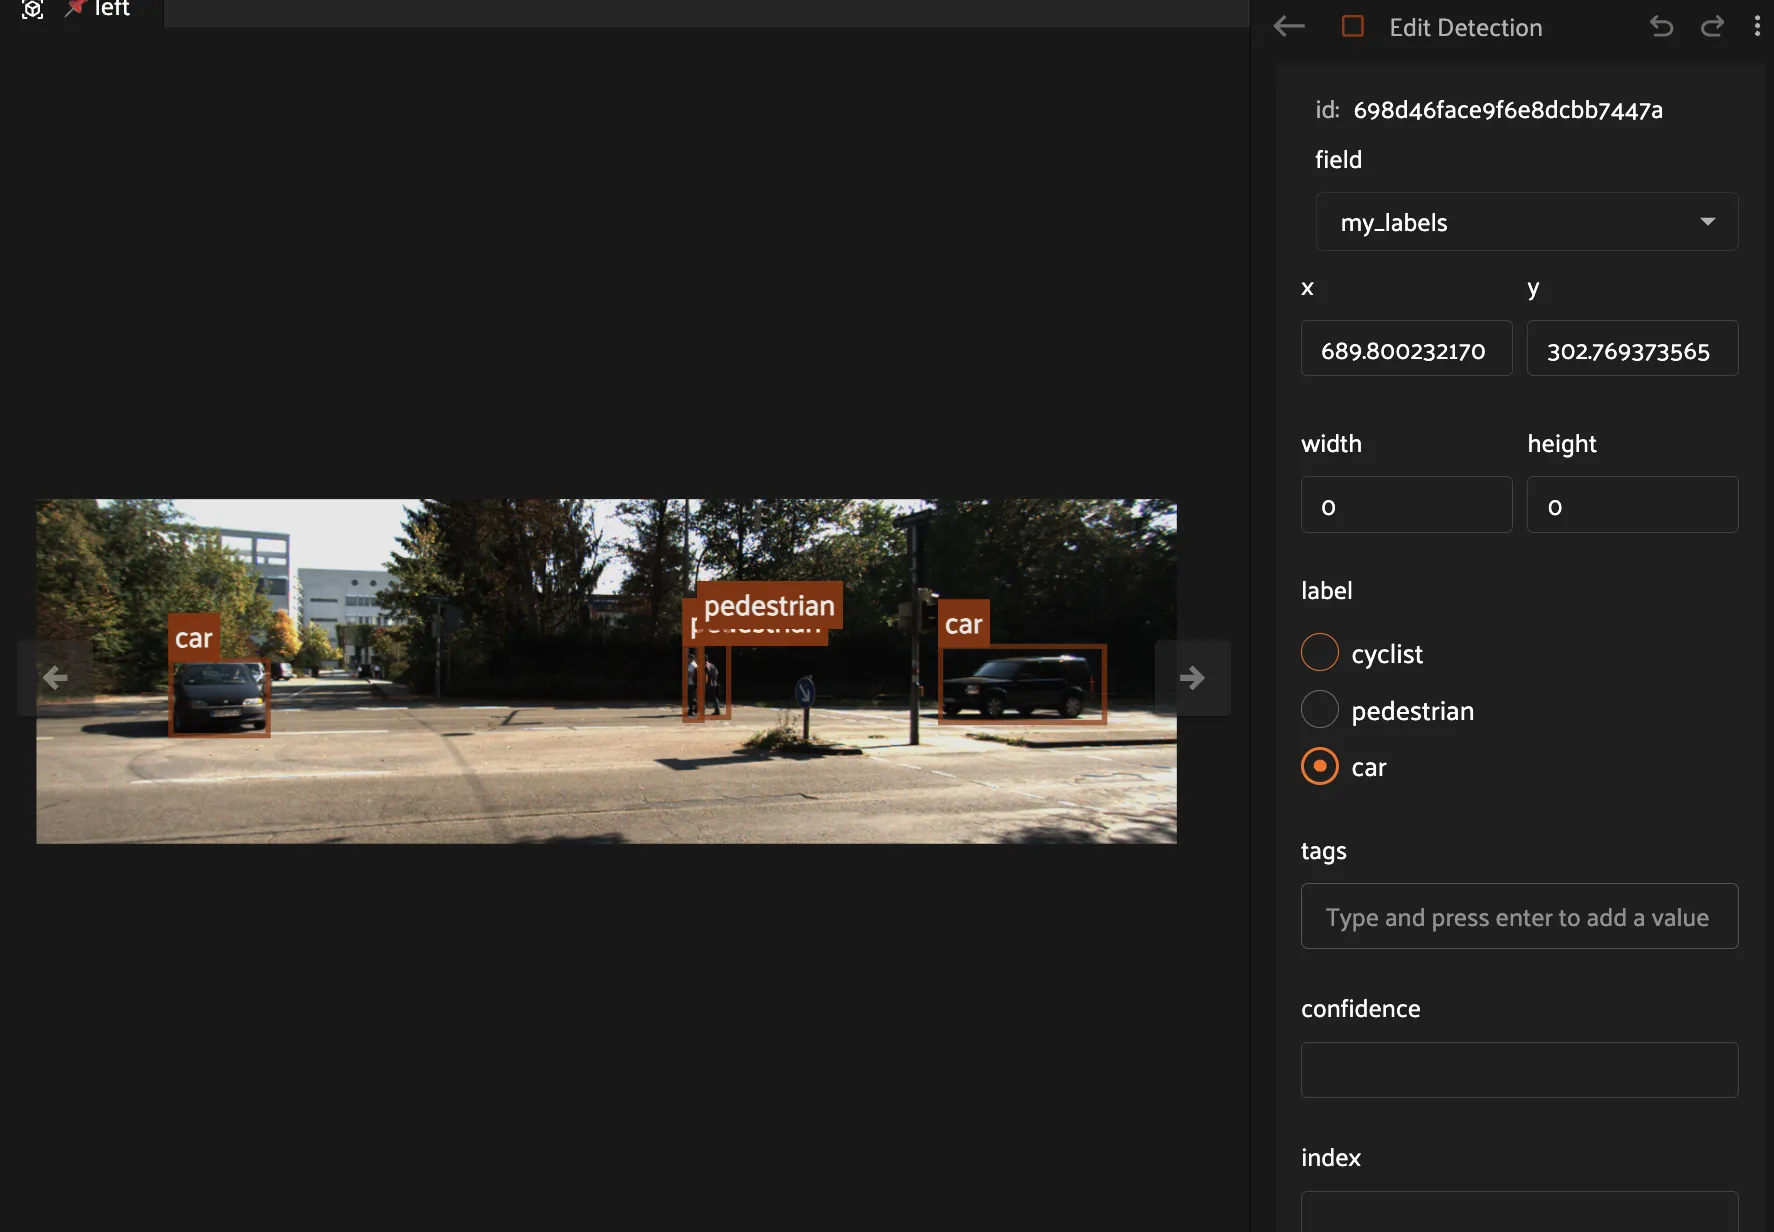
Draw 2D Bounding Boxes#
Click the Detection button (square icon)
Click and drag on an object to draw a box
Select a label from the class list in the sidebar
Your label saves automatically!
Tips:#
Resize: Drag corners or edges
Move: Click inside and drag
Delete: Select and press Delete
Try it: Draw 3-5 boxes on different objects, then move to a few more samples.
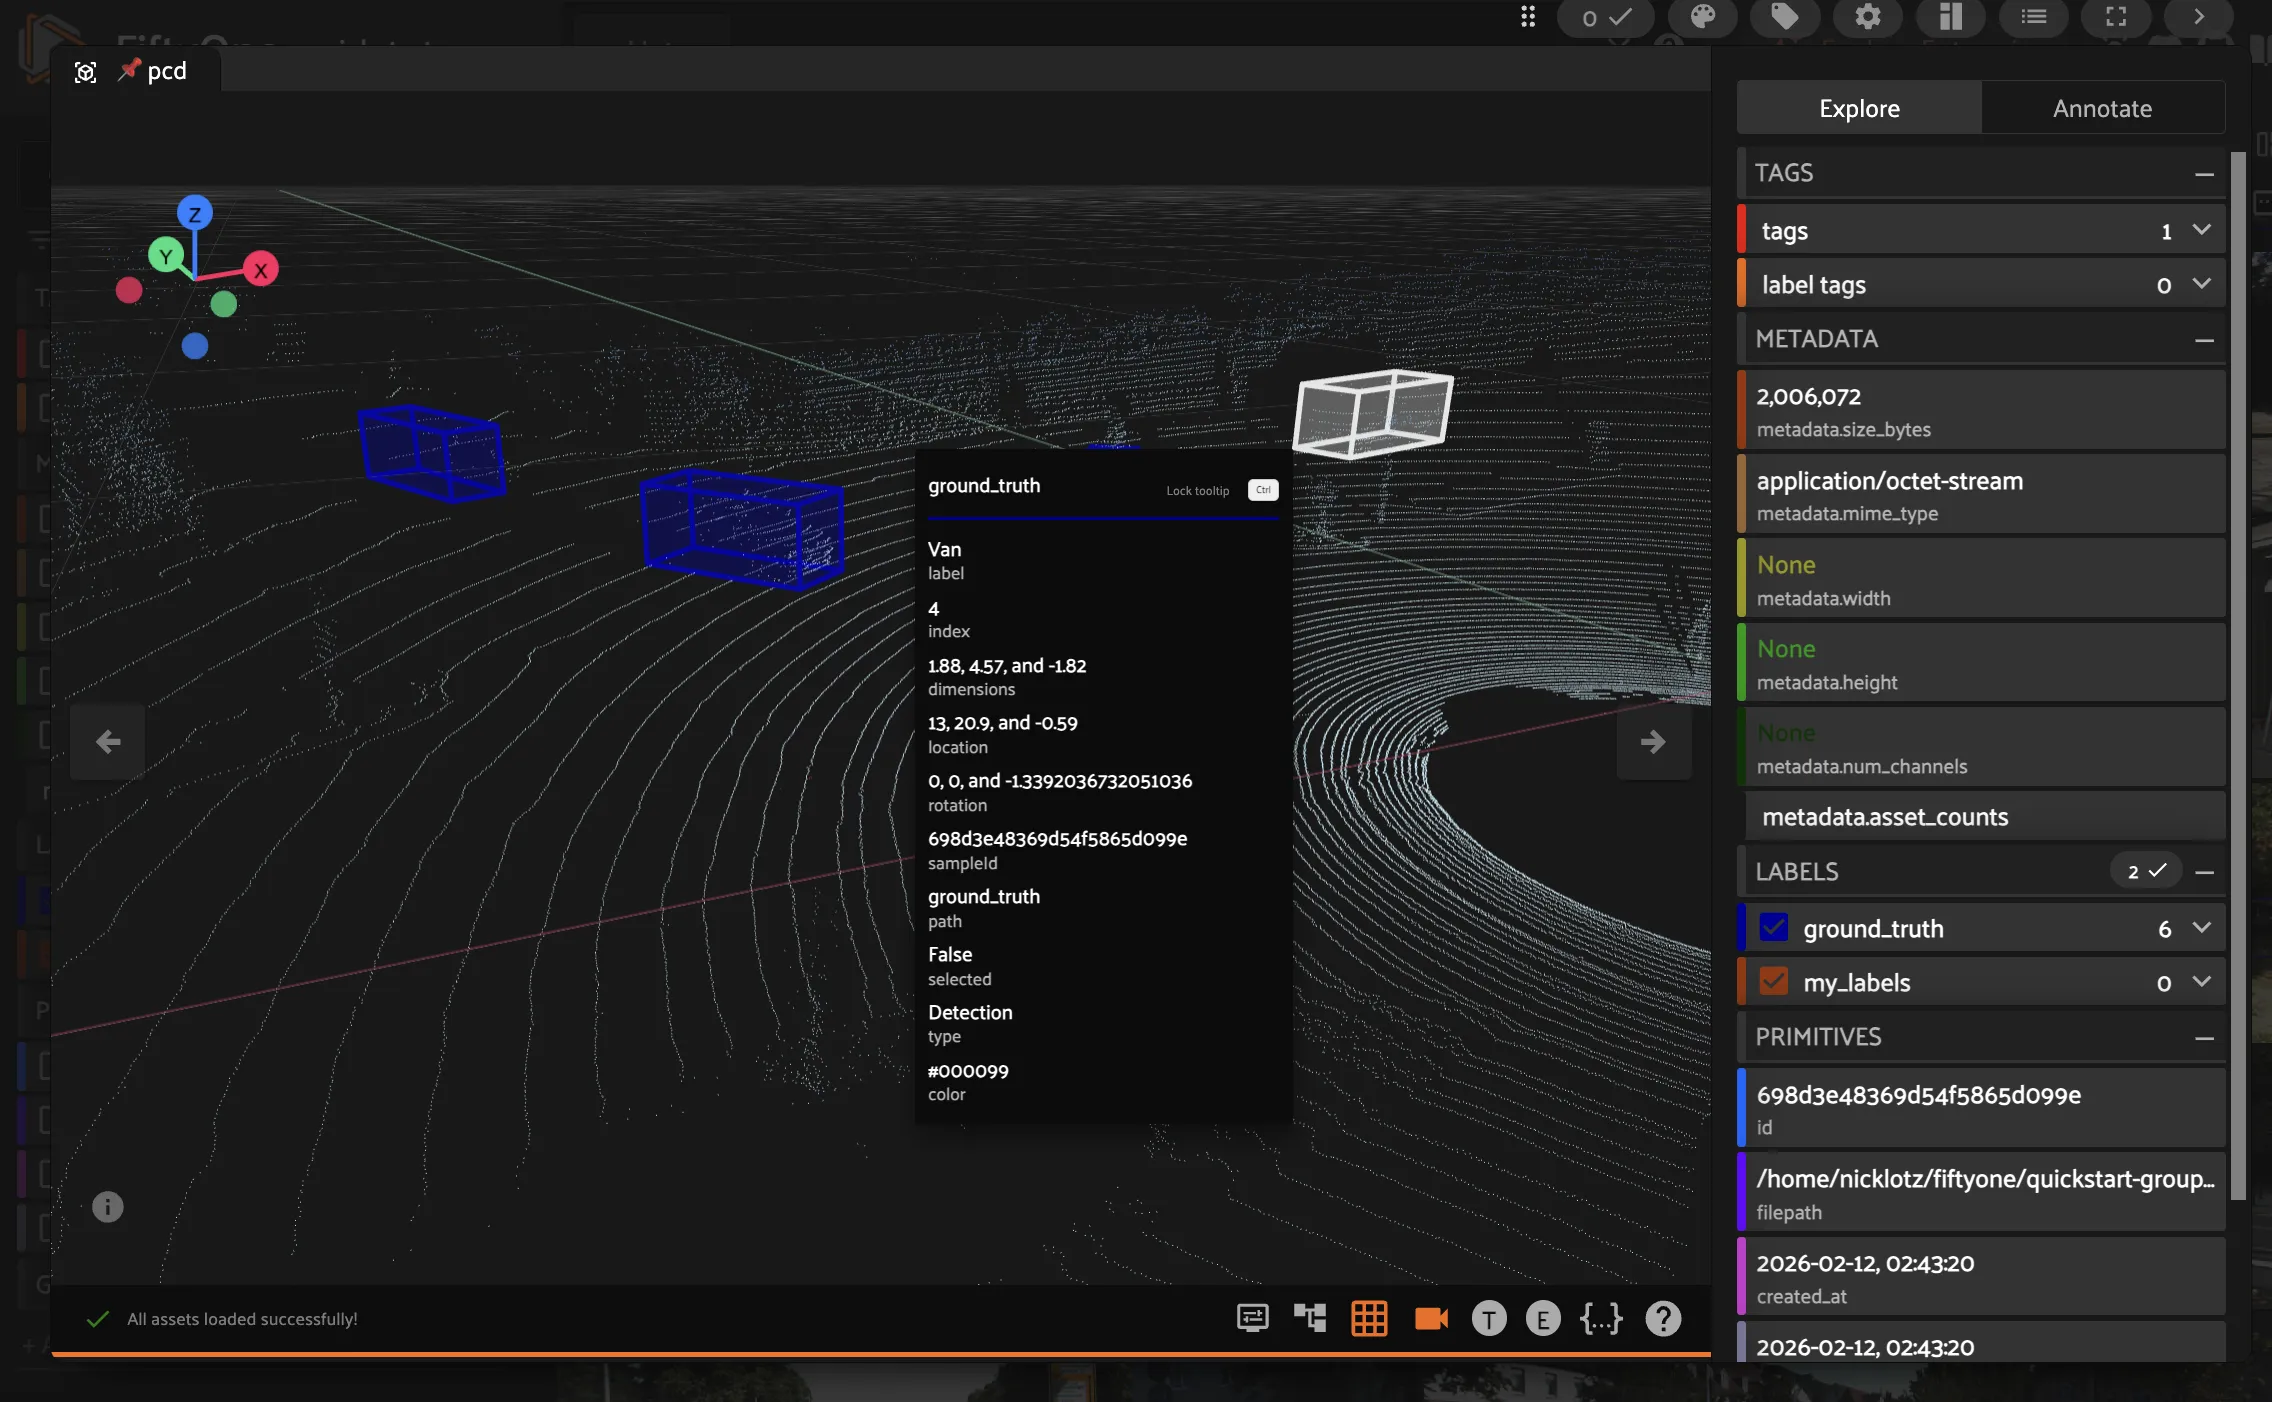
Explore 3D Data#
Now let us look at the point cloud:
Switch to the ``pcd`` slice using the Annotating Slice dropdown in the Annotate tab
Switch to the Explore tab to see the existing
ground_truthlabels as 3D cuboidsThe 3D visualizer loads the point cloud
Navigate:
Rotate: Left-click and drag
Pan: Right-click and drag (or Shift + left-click)
Zoom: Scroll wheel
Reset view: Press
1,2,3, or4for preset angles
Verify Your Labels Saved#
Run this after labeling some samples:
[ ]:
# Reload to see changes
dataset.reload()

LABEL_FIELD = "my_labels"

# Check if field exists and has labels
if LABEL_FIELD in dataset.get_field_schema():
    # Get left camera slice (where we annotated)
    left_view = dataset.select_group_slices(["left"])
    labeled = left_view.match(F(f"{LABEL_FIELD}.detections").length() > 0)

    total_dets = sum(
        len(s[LABEL_FIELD].detections)
        for s in labeled
        if s[LABEL_FIELD] is not None
    )

    print(f"Samples with labels: {len(labeled)}")
    print(f"Total detections: {total_dets}")

    if len(labeled) > 0:
        sample = labeled.first()
        print(f"\nExample from {sample.filepath.split('/')[-1]}:")
        for det in sample[LABEL_FIELD].detections:
            print(f"  {det.label}")
else:
    print(f"Field '{LABEL_FIELD}' not found.")
    print("Create it in the App: Annotate tab -> Schema -> New Field")
Key Concepts#
Grouped Datasets#
Link related samples (same scene, different sensors)
Each group has multiple slices (left, right, pcd)
Use the slice selector to switch views
Slice Selector in Annotate Tab#
Shows which slice you’re annotating
Switch to
leftfor 2D camera annotationSwitch to
pcdfor 3D point cloud viewing
Ephemeral vs Persistent#
This quickstart works on the zoo dataset directly (changes are ephemeral)
For persistent work, clone the dataset (covered in Full Loop)
Summary#
You learned how to:
Load a multimodal grouped dataset (KITTI)
Navigate between 2D and 3D slices
Create annotation fields and draw 2D bounding boxes
Explore point cloud data in the 3D visualizer
That’s multimodal annotation in FiftyOne.
What’s Next?#
For production annotation workflows, continue to the Full Loop Track:
Step 2: Setup Splits - Create proper train/val/test splits at the group level
Step 3: Smart Selection - Use diversity sampling to pick high-value scenes
Step 4: 2D Annotation - Disciplined labeling with QA checks
Step 5: 3D Annotation - Annotate cuboids on point clouds
Step 6: Train + Evaluate - Train a model and analyze failures
Step 7: Iteration - Use failures to drive the next labeling batch
The Full Loop clones the dataset to annotation_tutorial for persistent work.