Note
This is a community plugin, an external project maintained by its respective author. Community plugins are not part of FiftyOne core and may change independently. Please review each plugin’s documentation and license before use.
Line 2D#
|
|
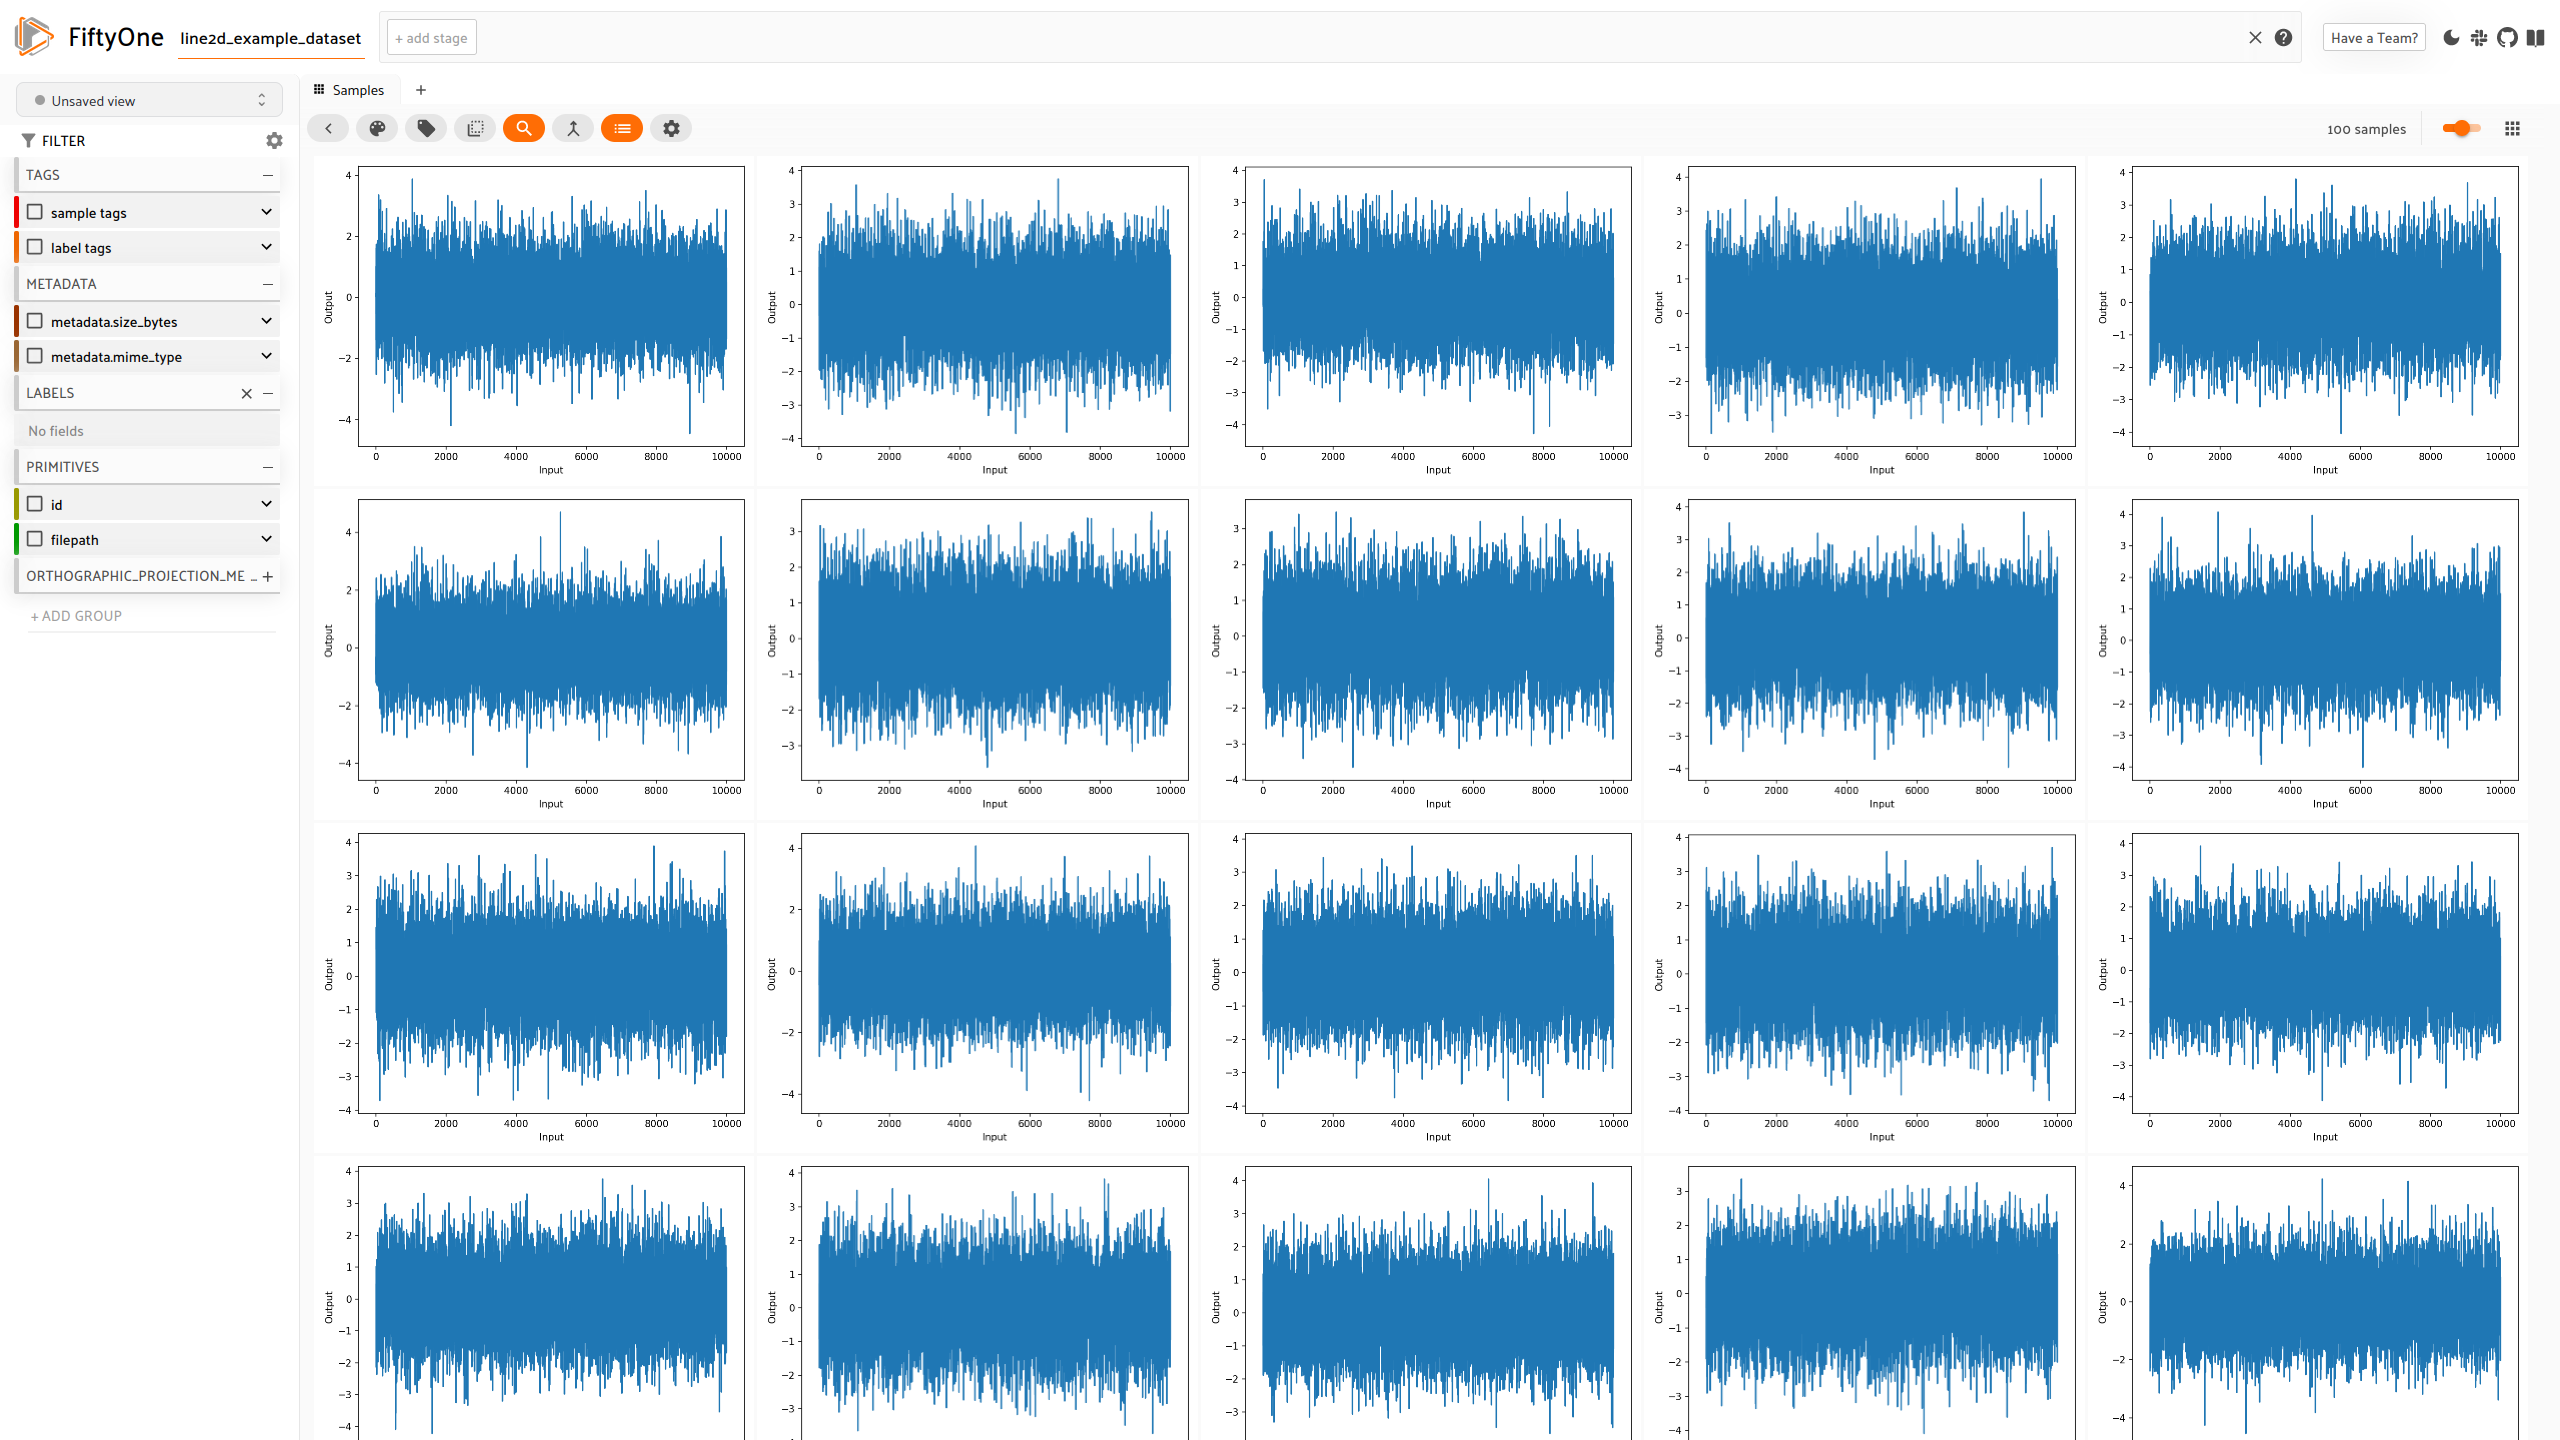
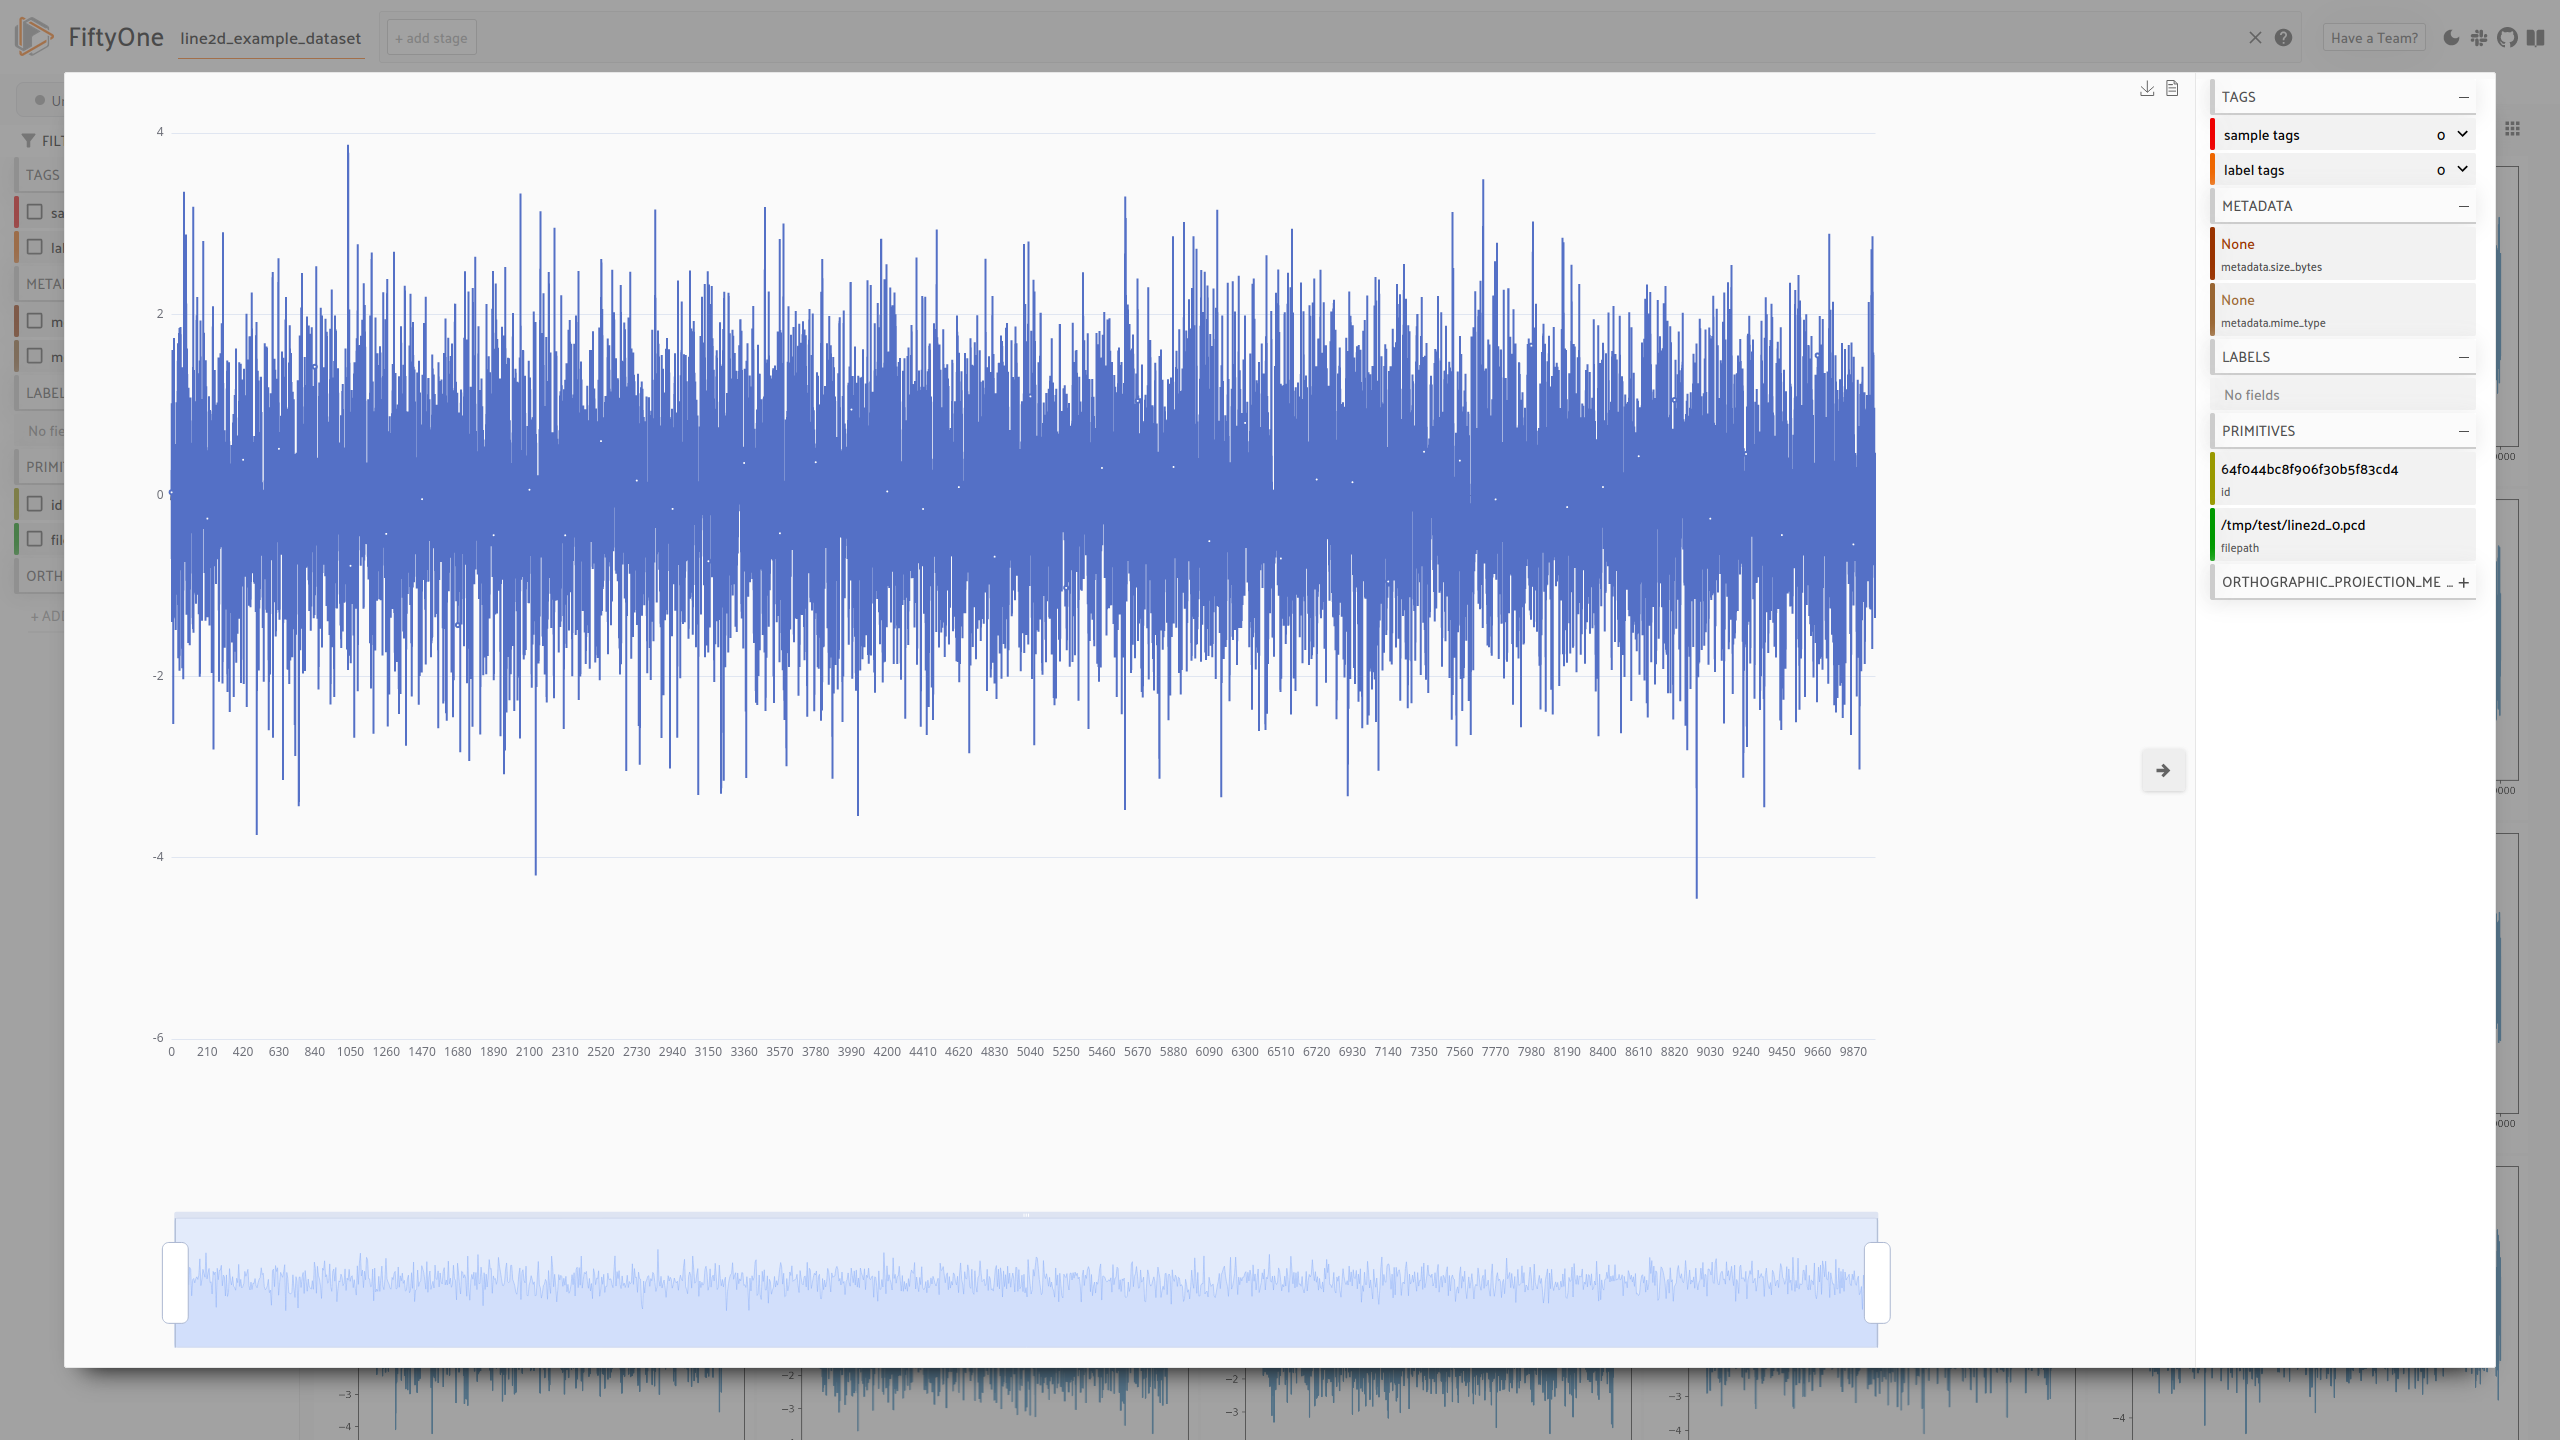
This plugin uses eCharts to visualize x,y-Points as a line chart. For now the visualizer component can only be overwritte by a plugin if its filepath has an “.pcd”-extension.
So files has to be converted to be usable with this plugin. It expects json files with an “.pcd”-extension with json["x"] representing the x-coordinates and json["y"] the y-coordinates.
Example file#
{"x": [0, 1, 2, 3], "y": [0.46, -0.20, 1.21, 0.69]}
In LoadExampleData in __init__.py you can see how data can be gernerated.
The plugin also adds two buttons “Genrate Thumbnails” and “Generate Example Dataset”.
Plugin Installation#
To install the plugin, run the following command:
fiftyone plugins download https://github.com/wayofsamu/line2d
Operators#
line2d_example_dataset#
Generate an example dataset at given path
line2d_thumbnails#
Generate thumbnails into the same directory as the dataset files are