## Overview
This guide will walk you through the basics of FiftyOne’s in-App annotation features.
Currently in-App annotation is designed for ad hoc, sample-by-sample metadata editing. The features and controls extend FiftyOne’s existing data visualization UI. Once you have samples loaded into a FiftyOne dataset, you can begin defining your Annotation Schema and labeling your data in the App.
---
## Basics
### Supported Media and Label Types
In-App annotation within FiftyOne supports datasets containing the following media and label types:
* [media_type](using_datasets.md#dataset-media-type)
* `image`
* `video`
* `3D`
* [Labels](basics.md#basics-labels)
* `Classification`
* `Detections`
* `Instance segmentations`
* `2D Polylines and Polygons`
* `3D Polylines`
* `3D Cuboids`
* `Events (Temporal Detections)`
### Annotation UI: Sample Visualizer
All in-App annotation controls now live in the [expanded view for samples](app.md#app-sample-view). Open a sample in the expanded view, and find the new “Annotate” tab in the right sidebar.

### Saving and Reverting Changes
When you make changes to sample metadata with FiftyOne’s in-App annotation, your changes automatically save to the database. The auto-save functionality triggers either explicitly after an action (e.g., deleting a label) or after a short period of time (e.g., updating the spatial properties of a bounding box multiple times in succession), depending on the action.
You can tell whether your changes are saved or are in the process of being saved thanks to this indicator:

#### Undo/Redo

While editing metadata, you can undo and redo actions using the buttons in the upper-right corner of the “Annotate” panel, or via `Ctrl+`/`Cmd+z` and `Ctrl+`/`Cmd+y`. Your changes included in the undo stack are limited to your active annotation session, i.e., while the expanded view remains open.
---
## User Guide
### Schema Import / Management
To perform in-App annotation, your dataset must first have an “Annotation Schema”. For a field, attribute, or value to be available in in-App annotation, it must be present in the Annotation Schema. Currently, you may only have one Annotation Schema per dataset, and your Annotation Schema applies across all samples and views on the dataset.
#### WARNING
Only users with [“Can manage” access](../enterprise/roles_and_permissions.md#enterprise-can-manage) to a dataset may import and manage the Annotation Schema on that dataset.

When accessing the “Annotate” tab in the expanded view on a dataset for the first time, you’ll see a button to create the Annotation Schema. By default, **no** [fields in the dataset schema](using_datasets.md#using-fields) are included automatically in the Annotation Schema; you’ll need to explicitly add fields, attributes, and values.
#### Supported Field Types
FiftyOne’s in-App annotation supports two groups of field types: **label-type** fields (e.g., `Detections` or `Classification`) and non-label-type **primitive** fields (e.g., `StringField`s or `IntField`s). Your Annotation Schema can be a mix of fields within these groups. The parameters available for configuring fields’ schemas in your Annotation Schema will depend on the type of field (see: [Annotation Schema Format](#annotation-schema-format)).
#### Schema Manager

The “Schema Manager” user interface defines the Annotation Schema for the dataset. The main page of the Schema Manager features two sections: “Active fields” and “Hidden fields”.
“Active fields” are fields included in your Annotation Schema.
“Hidden fields” are all fields not yet included in your Annotation Schema, but that can be activated for your Annotation Schema. To activate (a) field(s) for your Annotation Schema, check the box next to the field(s) you want, then click “Move…to active fields”.
##### Ordering in the Annotation Schema
Across the Schema Manager you’ll see handles to drag-and-drop `fields`, `classes`, `attributes`, and `values` within sections. You can reorder this information to update how values appear in the “Annotate” tab of the sample expanded view.
For example, reordering a primitive field `foo` above another primitive field `bar` will cause `foo` to appear above `bar` in the [list of primitives in the “Annotate” tab](#list-of-primitives).
#### Configuring a Field Schema
Before you can add a field to the Annotation Schema, you must first configure its schema. Click the ✏️ icon on any field in the Schema Manager (including both the “Active fields” and “Hidden fields” sections) to open the “Edit field schema” page and configure that field’s schema.
You can compose a field’s schema from scratch, or scan all samples across the dataset to import metadata. If you choose to scan the dataset, you may edit the results of that scan before saving the schema.
#### WARNING
Because scanning for metadata looks at samples across your entire dataset, it could take a few seconds or minutes.
The “Edit field schema” page includes two ways for you to configure the field’s schema: GUI or JSON. Both interfaces represent the same data model, and any updates you make in one interface should update the data model’s representation in the other interface in realtime.
##### Annotation Schema Format
The in-App Annotation Schema format is borrowed from [FiftyOne’s existing label_schema format](../integrations/annotation.md#annotation-label-schema) (historically supported for requesting annotations from third-party backends).
For label-type fields, `classes` are a first-order list of classes available for selection on all instances of your label across samples in your dataset. Label-type fields also have `attributes`, which are optional semantic properties whose values may also be edited across samples on your dataset.
For both primitive fields and `attributes`, the following properties apply:
* `type`: the data type (e.g., `int`, `str`).
* `component`: the UI component through which values are edited on the “Annotate” tab. Available `component`s include:
* `text`: a free text field. Applicable when `type` is `str`, `int`, `float`, or `list`.
* `dropdown`: an autocomplete dropdown menu. Applicable when `type` is `str`, `int`, `float`, or `list`. `values` is required.
* `radio`: a radio button group. Applicable when `type` is `str`, `int` or `float`. `values` is required.
* `slider`: a numeric slider and numeric input boxes. Applicable when `type` is `int` or `float`. `range` is required.
* `toggle`: a toggle where one and only one of two possible options must be selected. Applicable when `type` is `bool`.
* `datepicker`: a calendar date picker component. Applicable when `type` is `date` or `datetime`.
* `json`: an editable JSON code block. Applicable when `type` is `list` or `dict`.
* `values`: the list of allowed values available for selection in the `attribute` or primitive.
* `range`: the `[min, max]` values available for numeric `type`s, used in the `slider`. When `range` is defined, `values` must be omitted.
* `default`: the default value assigned to the attribute on new label instances. Not applicable to primitive fields.
**Reserved attribute names**
When configuring your field’s schema, you may not use any of the following reserved key names:
* `color`
* `id`
* `isNew`
* `path`
* `selected`
* `sampleId`
* `type`
##### Configuring with GUI
Here you’ll see different sections depending on whether your field is a label-type, or a non-label primitive field.
For label fields, you’ll see sections for adding and editing label `classes` and `attributes`. Click the “+Add class” or “+Add attribute” buttons to create new `classes` and `attributes`, respectively.
For each `class` and `attribute` in the GUI:
* Click the ✏️ icon to edit its properties.
* Click the 🗑️ icon to delete.
* Drag and drop `classes` or `attributes` within sections to reorder within the Annotation Schema (see: [Ordering in the Annotation Schema](#ordering-in-the-annotation-schema)).
For primitives, depending on your field’s data type, you’ll see optional and/or required properties to configure for your field’s schema.
#### Creating New Fields
Click the “New field” button in the Schema Manager to begin creating a new field on your dataset.
On the next screen, you’ll need to provide a unique name for your new field. Next, choose whether your new field should be a label-type field, or primitive. In either case, open the “Field type” dropdown menu to choose a data type for your new field.
You’ll then see different sections depending on your choices. Once you are satisfied with your new field’s configuration, click the “Save” button, and two things happen:
1. Your new field immediately gets written to the database
2. Your new field is added as an “Active field” in the Annotation Schema
To cancel at any time while configuring your new field, click the “Discard” button.
#### Ontologies
An Annotation Ontology is a global, named, versioned resource that bundles a
reusable set of typed attributes — with optional
[conditional display logic](#annotation-conditional-attributes) — into a
single document that can be attached to a label schema field. Ontologies live
outside any dataset, so multiple datasets and fields can reference the same
ontology by name.
Create and save an ontology with the SDK:
```python
import fiftyone as fo
ontology = fo.AnnotationOntology(
name="vehicle_damage_ontology",
attributes=[
fo.AttributeSpec(name="damage_present", type="bool", component="toggle"),
],
)
ontology.save()
```
Attach the ontology to a field on a dataset’s label schema:
```python
import fiftyone as fo
dataset = fo.load_dataset("my_dataset")
label_schemas = fo.apply_ontology(
dataset.label_schemas,
field_name="detections",
ontology_name="vehicle_damage_ontology",
)
dataset.set_label_schemas(label_schemas)
```
Pass `ontology_name=None` to `apply_ontology()` to unset an existing
reference on a field.
#### Conditional Attributes
Attributes in an [Annotation Ontology](#annotation-ontologies) can be shown
conditionally based on other values on the same label. Pass a `when`
condition to `AttributeSpec` — the `field` may reference any attribute on
the parent, including `label` itself.
```python
import fiftyone as fo
fo.AnnotationOntology(
name="vehicles",
attributes=[
fo.AttributeSpec(
name="num_doors",
type="int",
component="text",
when=fo.WhenEquals(field="label", value="car"),
),
fo.AttributeSpec(
name="cargo_capacity",
type="float",
component="text",
when=fo.WhenEquals(field="label", value="truck"),
),
],
).save()
```
`num_doors` is editable only when the label’s class is `car`, and
`cargo_capacity` only when it is `truck`. Hidden attributes are not
written to the label.
Once this ontology is attached to a label field, annotators will see
these conditional attributes in the right sidebar of the in-App
annotation UI as they annotate.
#### Bypassing Schema Configuration
If you do not see a field or its contents in the “Annotate” tab of the sample expanded view, and you don’t want to go through the process of configuring a schema for the field and adding it to the Annotation Schema, you can bypass interacting with the Schema Manager altogether and ask the FiftyOne App to take the requisite steps on your behalf.
#### WARNING
Like the above features in [the “Schema Import / Management” section](#schema-import-management), this bypass feature is only available to users with [“Can manage” access](../enterprise/roles_and_permissions.md#enterprise-can-manage) on a dataset.

While on the “Explore” tab of the sample expanded view, hover over the field with objects/values you wish to edit via in-App annotation, and you’ll see a ✏️ icon. When you click the ✏️ icon, if no valid schema exists yet for that field–and the field does not exist in the Annotation Schema, the following happens:
1. The App scans your dataset to impute a schema for the field
2. The App then adds your field to the Annotation Schema, using the imputed field schema
3. You are then navigated to the “Annotate” tab and placed into either an edit context for your field or a filtered [list of label instances](#list-of-label-instances), depending on your field’s type
### Getting Started with Annotation
To access fields in the “Annotate” tab, first check the box next to the field in the “Explore” tab. Only those labels you are visualizing in the “Explore” tab will be available for in-App annotation in the “Annotate” tab.

While in the “Annotate” tab, the sample expanded view consists of three parts:
1. The “Annotation Canvas”
2. Annotation actions toolbar
3. List of label instances
#### Annotation Canvas
The Annotation Canvas is where you visualize your sample and interact directly with label instances using mouse and keyboard actions. We refer to the Annotation Canvas below when describing [3D](#creating-3d-polylines) and [2D](#creating-a-detection-label) label creations and edits in more detail.
You can edit an existing label instance by clicking on that label instance on the Annotation Canvas.
#### Annotation Actions Toolbar
The annotation actions toolbar is where you can create a new label instance or (if you are a user with “Can manage” access on the dataset; see [above](#schema-import-management)) access the Schema Manager and Annotation Schema.
#### List of Label Instances
Under the “Labels” header, you’ll see a flattened list of all label instances included in fields enabled while in the “Explore” tab. You can edit an existing label instance by clicking on that label instance within the “Labels” list.
For label types with spatial properties (e.g., 2D bounding boxes), you’ll notice a visual indicator highlighting label instances in both the Annotation Canvas and “Labels” list as you hover over either part of the user interface.
#### List of Primitives
Labels are not the only type of metadata available for edits in FiftyOne’s in-App annotation functionality. Primitive [fields](basics.md#basics-fields) (e.g., `StringField`s or `IntField`s) on the dataset may also be made available in the Annotation Schema via [the Schema Manager interface](#schema-import-management). When primitives exist in the Annotation Schema, you’ll see a flattened list of all such fields under the “Primitives” header.
---
## How to: 2D Label Annotation
### Creating a Classification label

Click the “Create new classification” icon in the annotation actions toolbar to display the classification editor in the right sidebar. A field and label are required to save the new classification label. Only fields available in your schema will be displayed as options in the dropdown boxes.
### Creating a Detection label

Click the “Create new detection” icon in the annotation actions toolbar to enable the crosshair mouse cursor on the Annotation Canvas and display the detection editor in the right sidebar. Position the cursor at one corner of the new detection, then click and hold the mouse button while dragging diagonally to create a bounding box.

Once a bounding box has been created, it can be resized and repositioned as desired by clicking and holding any edge or corner drag handle while moving the mouse cursor. For finer adjustments, first zoom in on the image. To maintain the aspect ratio of the selection, hold down the shift key while dragging.
A field and label are required to save the new detection label. Only fields available in your schema will be displayed as options in the dropdown boxes.
A detection label’s size and shape can be adjusted directly in the annotation canvas by clicking on the detection to select it, then dragging an edge or corner drag handle:

### Creating a Segmentation label

Click the “Create new mask” icon in the annotation actions toolbar to enable the mask annotation toolbar displayed on the left side of the Annotation Canvas. Select the paintbrush, polyline, or AI tool to begin drawing masks.

When drawing segmentation masks, the mask toolbar is shown on the left of the Annotation Canvas. From top to bottom of the image above, the icons depict the Selection tool to select specific label instances, the Brush tool, Polygon tool, or AI assistance tool for drawing new masks, the Merge tool to combine mask instances, and Close to stop editing the current label instance.
A field and label are required to save new mask labels. Only fields available in your schema will be displayed as options in the dropdown boxes. Instance segmentations fall under the `Detections` label field type, allowing for detection labels either with or without masks.

The kebab menu on an existing detection label in the right sidebar allows you to either add or remove the mask from that label instance.

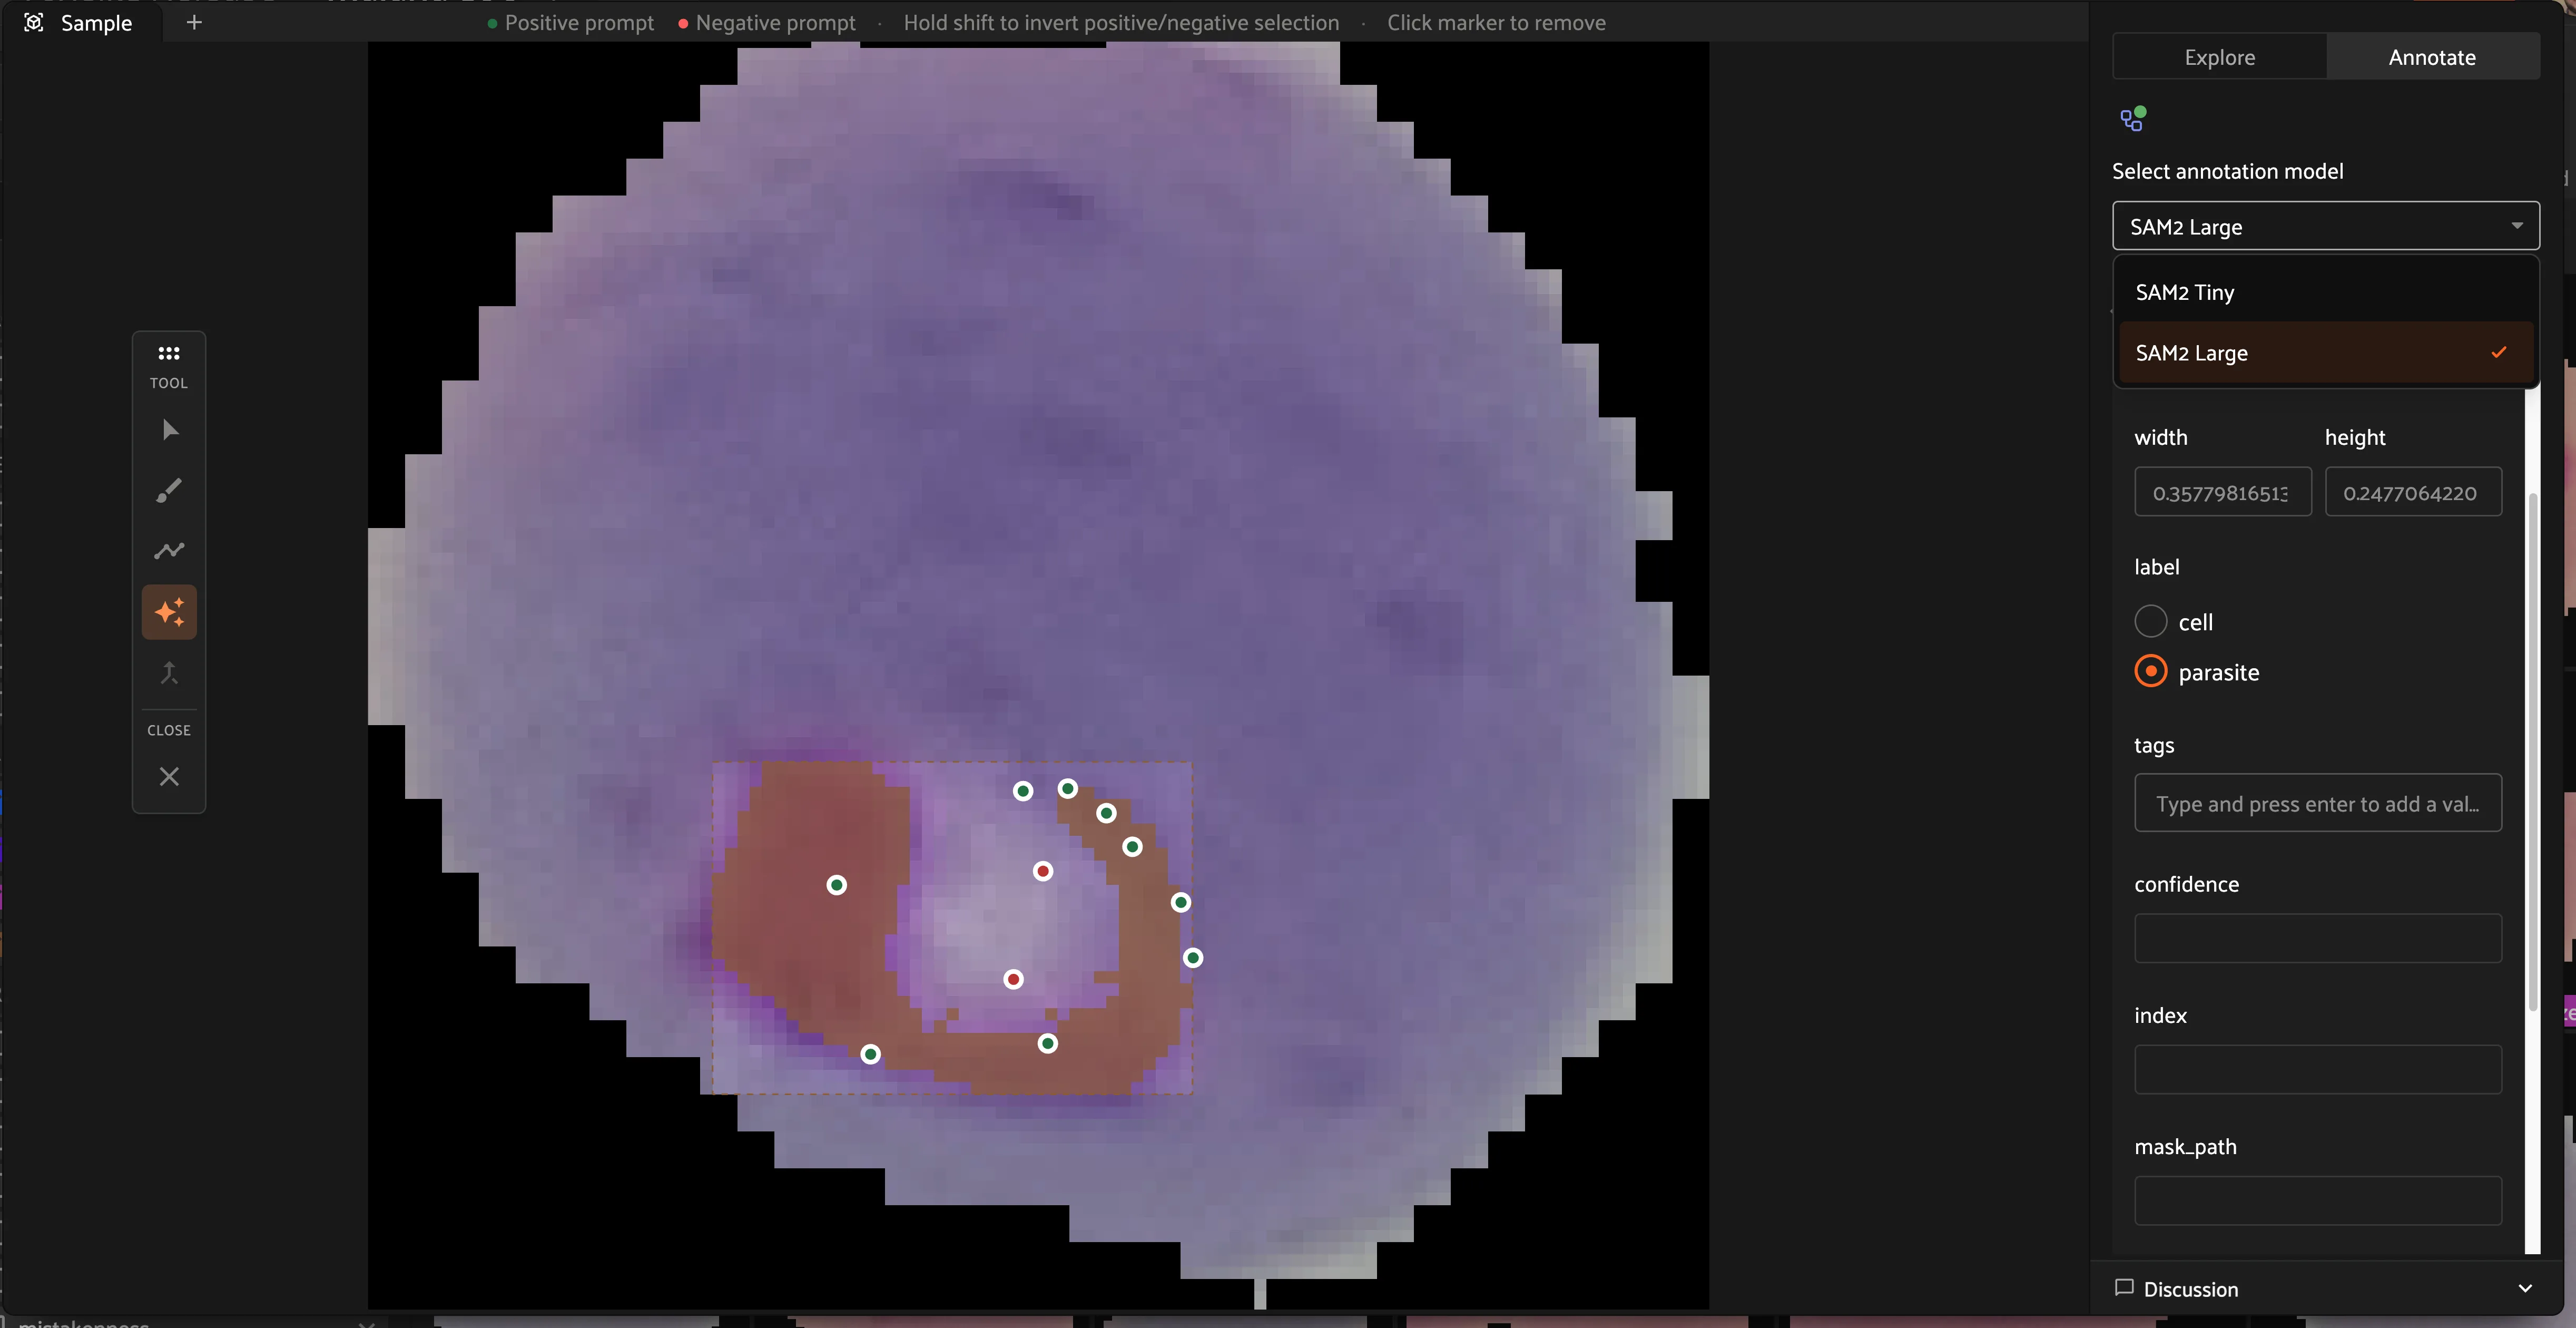
The AI assistance tool allows you to use mask segmentation models to draw masks. This tool allows you to click any number of positive and negative points per object as prompts to the model to refine the mask boundaries. For FiftyOne Enterprise customers, ask your Voxel51 Customer Success representative about bringing your own finetuned models for AI assisted segmentation.

The Brush tool allows for pixel-level precision to create masks. By selecting the `-` Mode, you can use the brush tool to remove pixels from existing masks. The Brush tool also allows you to configure the size and shape of the brush.

Similar to the brush tool, the Polygon tool allows you to create or remove masks from detection instances. Click the canvas to place points on the polygon, then right click to confirm your selection.

If multiple masks have been created for the same object, the Merge tool allows you to select one object instance and merge the mask of another instance into it.
### Creating Polyline and Polygon labels

Click the “Create new polylines” icon in the annotation actions toolbar to enable the crosshair mouse cursor on the Annotation Canvas and display the polylines editor in the right sidebar.

Click the canvas to begin placing vertices of the new polyline, with successive clicks connecting the vertices with line segments. Right click to finish editing the current polyline label instance. To add additional vertices onto an existing polyline, click the polyline segment at the desired location to place the new vertex.

[Polygon labels in FiftyOne](using_datasets.md#polylines) are simply polylines with the `closed` and `filled` attributes set to `True`. Configure the label schema to use default values for these attributes if desired, or configure these values for each label instance. Similar to polylines, edit polygons by clicking the canvas to place vertices defining the boundary of the polygon. Clicking an existing boundary segment allows you to add new vertices into an existing polygon. Right click the canvas to finish editing the current polygon.
### Editing in the Right Sidebar
Labels can be selected by clicking on its bounding box or on the item in the list in the right sidebar, which will highlight the associated bounding box on the annotation canvas if the label is a detection, then clicking the chosen row. This will open the editing panel in the right sidebar.

#### Spatial Properties

Within the editing panel spatial coordinates of the label are displayed. For example, for detection type labels the x/y coordinates, width, and height can be adjusted. Editing the x/y coordinates and/or the width/height will display the changes in the annotation canvas. This allows finite adjustments that could be difficult with a mouse.
#### Attributes
The editing panel also enables editing the label, tags, confidence, index properties, and custom properties depending on the configured annotation schema.
---
## How to: Video Annotation
In-App video annotation lets you draw object tracks and timeline events on
[video](using_datasets.md#dataset-media-type) samples. The
[Annotation Schema](#annotation-schema-format) and right-sidebar editing
behavior on the [Annotate tab](#annotate-tab) are the same as for image
annotation, and edits [auto-save](#saving-and-reverting-changes) through
the database the same way. The video annotation surface adds a timeline
below the canvas for scrubbing and to visualize tracks that maintain object
identities and events across frames.
### Requirements
Video annotation requires:
* A `video` [type dataset](using_datasets.md#dataset-media-type)
* Images sampled from the video and stored on the frames (see
[frame views](using_views.md#frame-views))
* Metadata computed on the samples
```python
import fiftyone as fo
dataset = fo.load_dataset("my-video-dataset")
assert dataset.media_type == "video"
dataset.compute_metadata()
dataset.to_frames(sample_frames=True)
```
### Creating Object Tracks
To create an object track, the
[Annotation Schema](#annotation-schema-format) needs to contain a
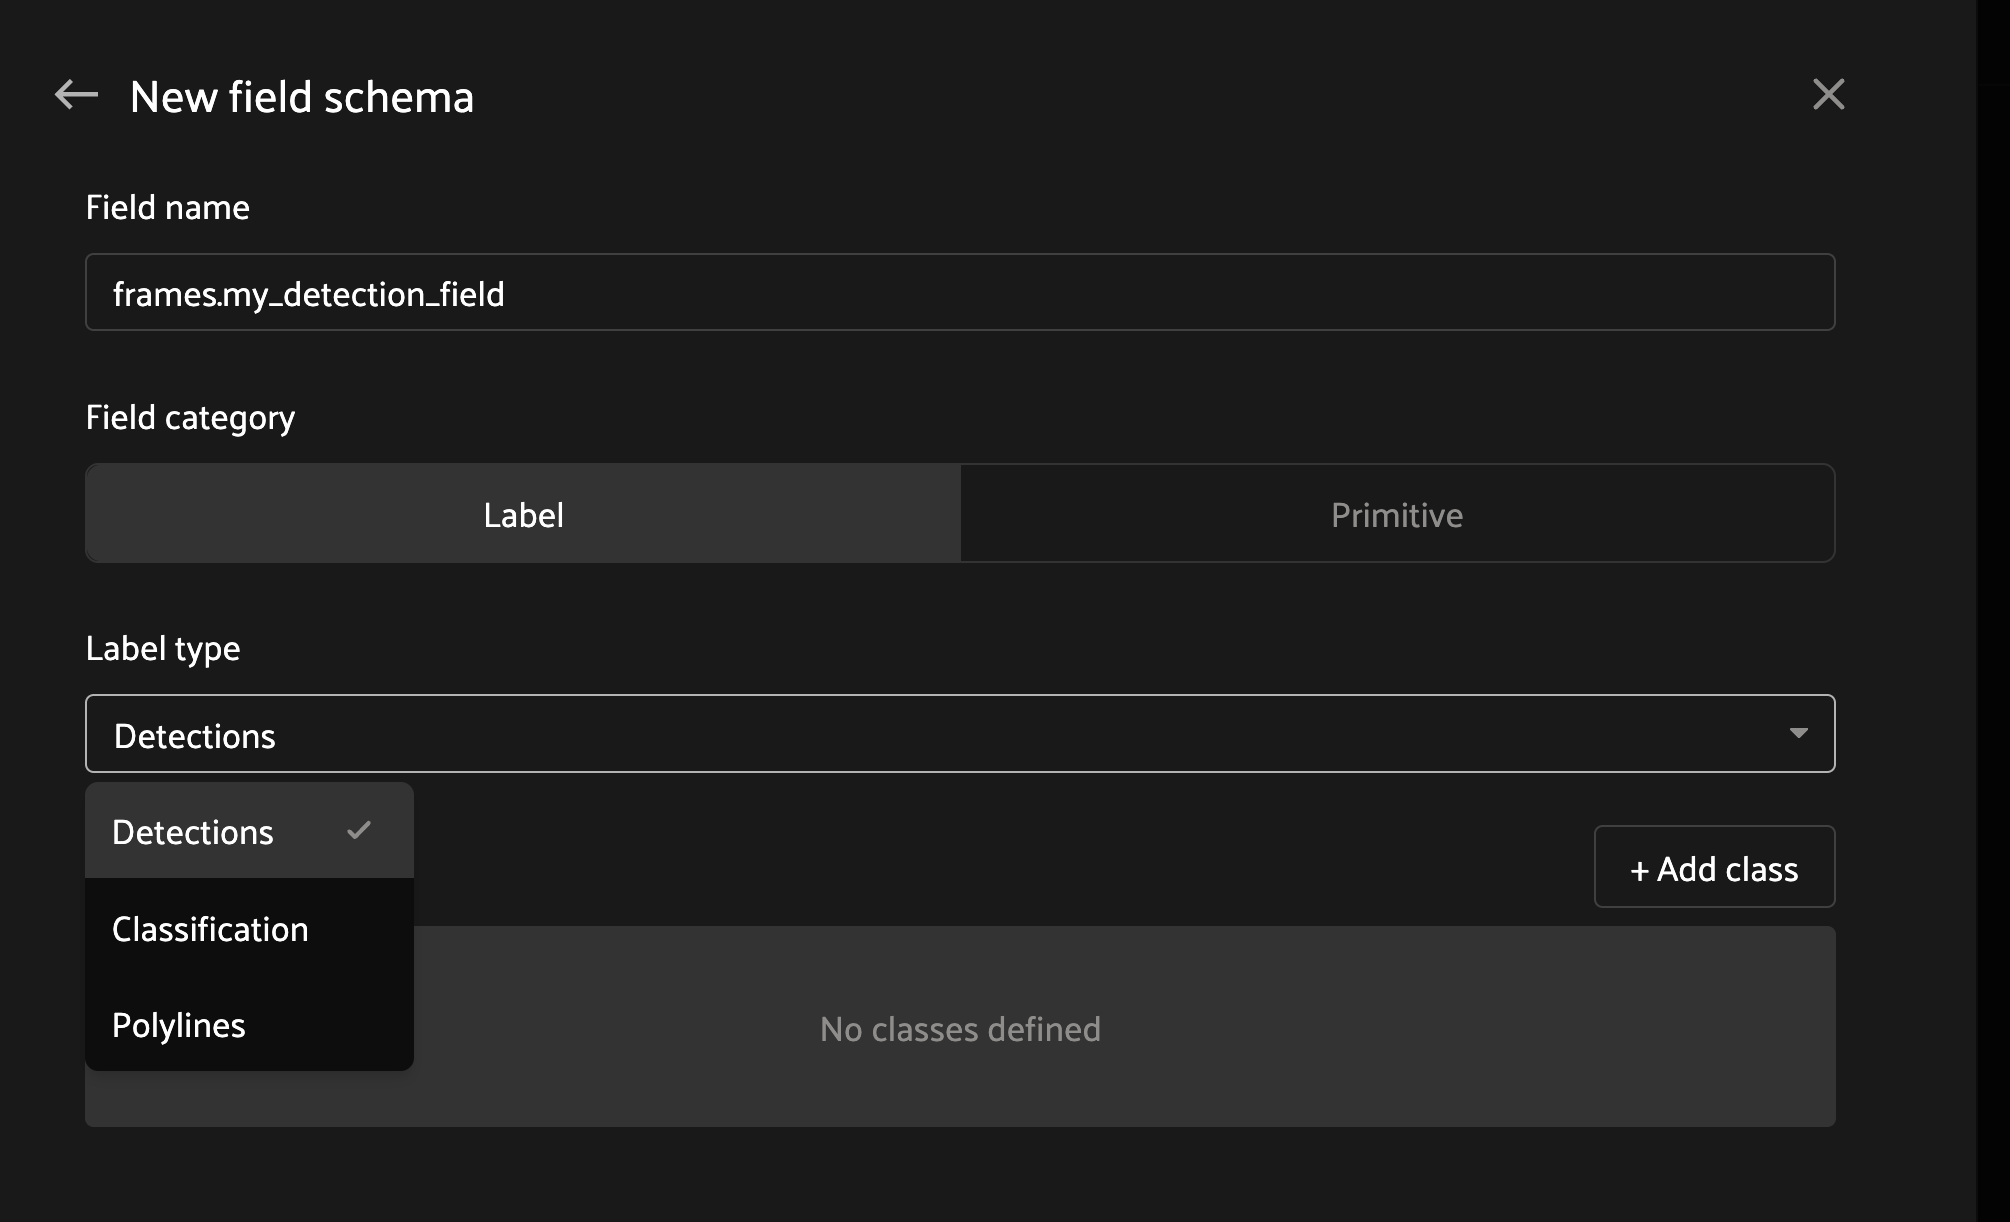
compatible field. Create a new field in the
[Schema Manager](#schema-manager) that is prefixed with `frames.`
indicating that the field will have frame-level labels of the object — for
example per-frame [Detections](using_datasets.md#object-detection) for
the bounding box of the object per frame.
To start a new object, click the bounding box icon in the annotate actions
toolbar and draw a box on the current frame. The first box creates a new
[`Instance`](../api/fiftyone.core.labels.md#fiftyone.core.labels.Instance) and marks a keyframe for
the object at that frame. Scrub the playhead forward and adjust the box on a
second frame to add the next keyframe. FiftyOne linearly interpolates the
bounding box between adjacent keyframes and updates the intermediate labels.
[Polylines](using_datasets.md#polylines) and mask labels are not
interpolated, simply propagated forward.
The start and end frames of an object track can be adjusted by dragging the
handles on the ends of the track segment in the timeline. Track segments
can also be dragged in their entirety to a new frame.
### Static and Dynamic Attributes
Tracks support two kinds of attributes, configured per-attribute in the
[Annotation Schema](#annotation-schema-format):
* **Static attributes** apply to the whole track. Their value is the same on
every frame. Use these for properties that don’t change across the track’s
lifetime (e.g. a vehicle’s `make` or `color`).
* **Dynamic attributes** can change value across a track. Use these for
properties that vary mid-track (e.g. `occluded`, `turn_signal`).
Each dynamic attribute has its own nested track under the parent object
track.
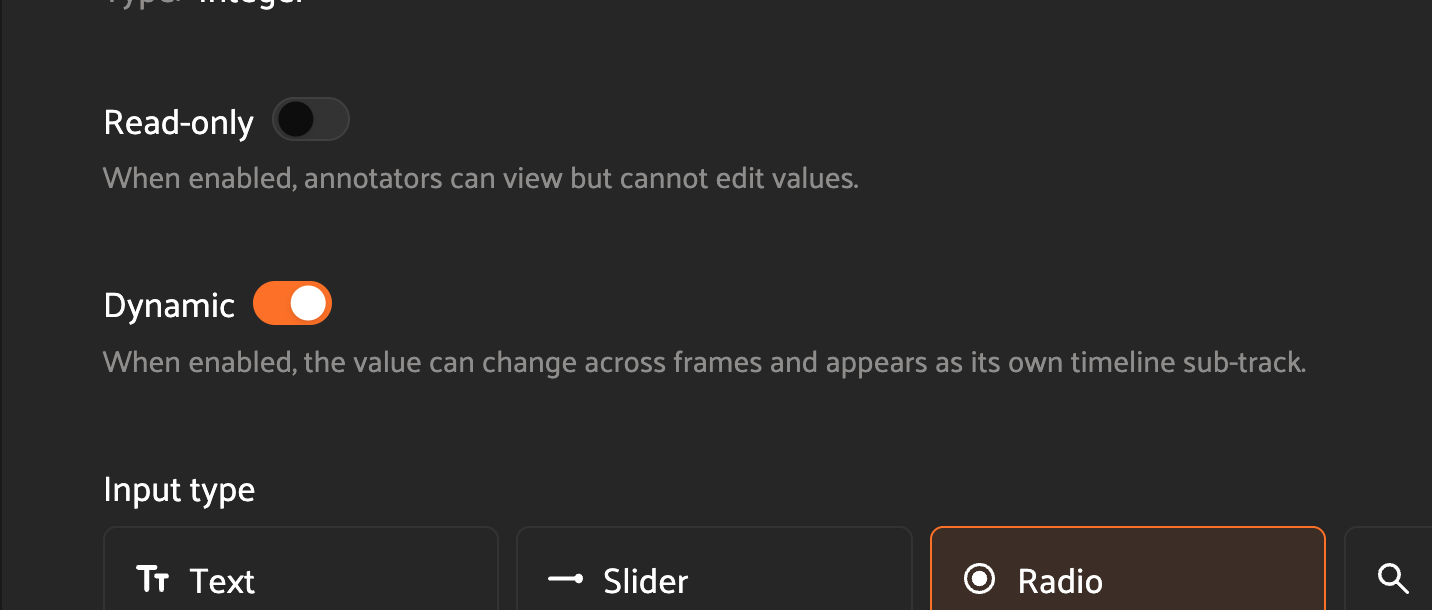
Static and dynamic attributes are both edited in the right sidebar. Static
attribute updates apply to every frame in the track. Dynamic attribute
updates propagate forward from the playhead until the next attribute value
change. Note that dynamic attributes do not have explicit keyframes.

### Keyframes
A **keyframe** is a frame at which a track’s value is explicitly set, as
opposed to interpolated from neighboring frames. Each object track row in the
timeline shows its keyframes as diamonds.
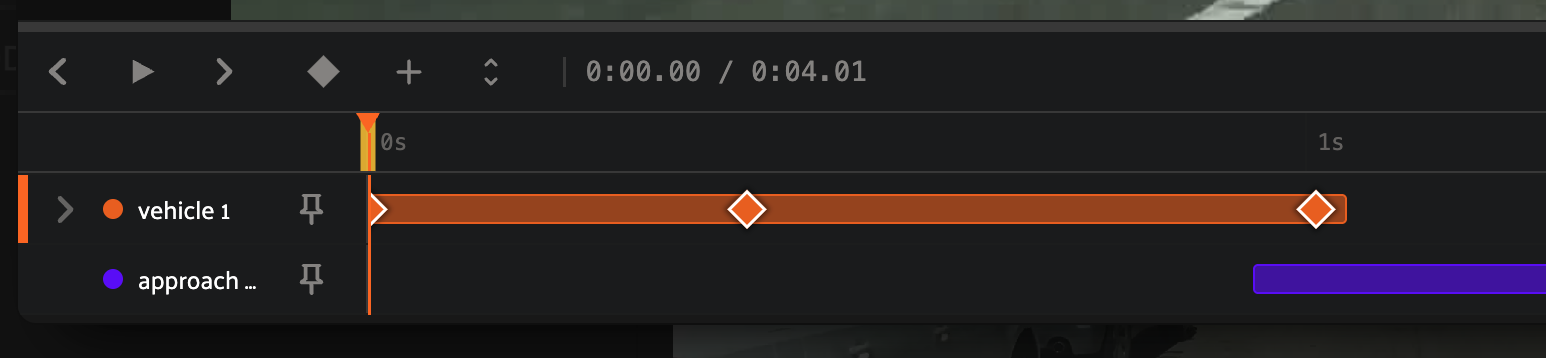
There are two ways a track’s value can vary over time:
* **Geometry keyframes** record an explicit bounding box, mask, or polyline
position. They are created automatically when you draw or resize an
object, or by pressing **K** at the playhead to commit the current
geometry without resizing. Between adjacent bounding box keyframes,
FiftyOne linearly interpolates the bounding box on edits. These
keyframes are indicated by diamonds.
* **Dynamic attribute changes** are propagated forward in time rather than
interpolated. When you change a dynamic attribute’s value from the right
sidebar, the new value is held forward until the next attribute change.
These changes are not explicit keyframes; they are indicated by
differently colored segments in the attribute sub-tracks.
The first frame of a track is always a keyframe. Press **K** with a track
selected, or click the  toolbar button, to manually mark a
geometry keyframe at the playhead without resizing the box. The same action
also removes an existing keyframe at the playhead, which triggers a new
interpolation/propagation between the adjacent keyframes.
### Temporal Events
Sample-level events (also known as
[Temporal Detections](using_datasets.md#temporal-detection)) are rendered as horizontal
bars in the **Events** lane at the bottom of the video timeline. Each event
has a label, a `support=[start_frame, end_frame]`, and user-defined custom
attributes.

To create an event, click the  button in the timeline
toolbar to create a new event at the current playhead position. Drag either
edge of an event bar in the timeline to adjust `support`. Select an event
to edit its label and attributes in the right sidebar.
### Timeline Operations
**Drag-to-retime.** Click and drag an event or object track horizontally to
move it to a new start and end time.
**Split.** With the playhead on the desired frame and a track selected,
click the  button in the toolbar to split the track into
two tracks at the playhead. The segment before the playhead retains the
original `Instance`; the segment after the playhead is assigned a new
`Instance`. Static attributes are copied to both tracks and dynamic
attributes are split at the playhead.
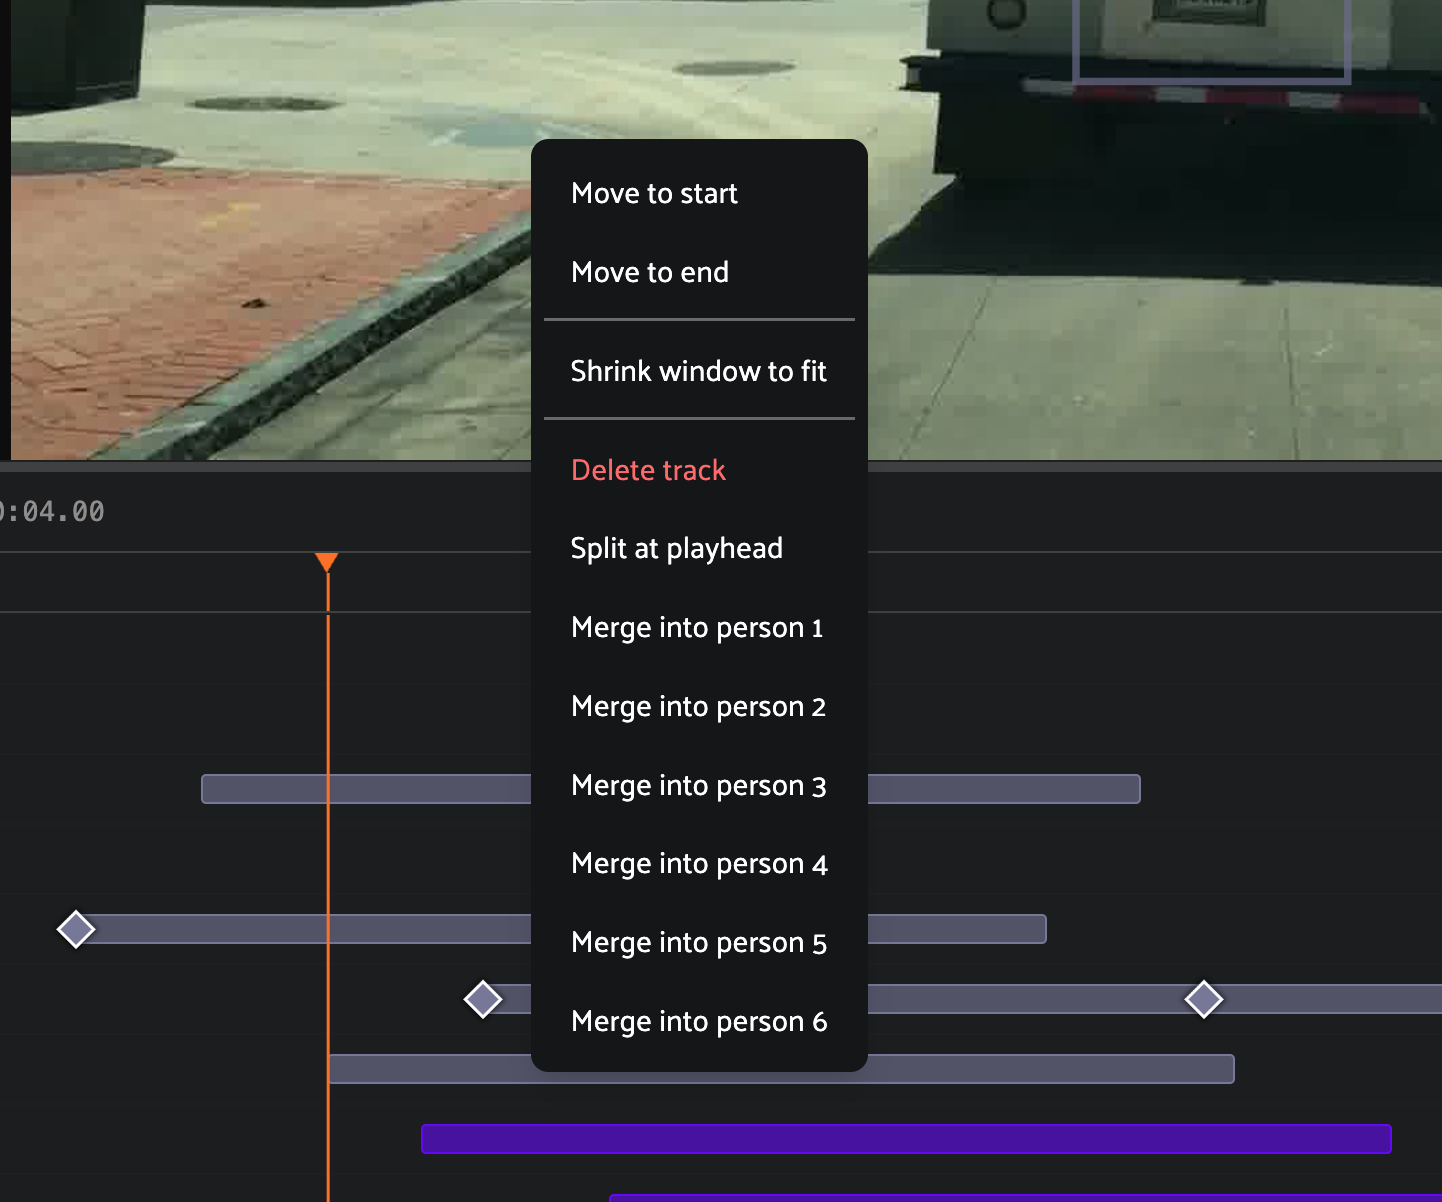
**Merge.** Right click an object track to merge it into another track of
the same class label. The two tracks combine into a single `Instance`
with the union of their keyframes. On conflict, attribute values from the
track being merged into take priority.
**Delete a track** by right clicking the track row and choosing **Delete
track**.
**Loop a track** by right clicking the track and choosing
**Shrink window to fit**. This loops playback over the track’s duration,
letting you focus on a specific object or event.
---
## How to: 3D Label Annotation
### 3D Annotation Mode
#### Supported 3D Datasets
3D annotation mode is only supported for `3d` [type datasets](using_datasets.md#d-datasets) and dataset views, or grouped datasets with `3d` slices.
#### NOTE
`point-cloud` [type datasets](using_datasets.md#point-cloud-datasets) are deprecated and do not support annotation. We recommend converting them to `3d` type datasets.
For grouped datasets, you can use the slice selector within the Annotate tab to select the image or 3d slice you wish to annotate.

#### Camera Projections
**Pointcloud projections**

Projection surfaces allow you to flatten a 3D point cloud onto a 2D plane for easier annotation. You can toggle between different projection views using the dropdown menus.
**2D Image Projections**
If your dataset contains [groups](groups.md#groups), where at least one group slice contains 2D images, you’ll also see those slices available for visualization in the dropdown menu.

If you have defined the necessary [camera intrinsic and extrinsic parameters](using_datasets.md#camera-intrinsics-extrinsics), then you will also be able to project the 3D labels onto the 2D images in real time.

### 3D Annotation Controls
#### Annotation Plane

3D annotation mode in FiftyOne provides the concept of an “annotation plane”. When a new point is created (for example the vertex of a polyline or cuboid), it gets placed at the location of the mouse pointer. However, the depth of the point would be ambiguous and so this annotation plane is used to define the point depth. By default, the annotation plane is set to be the XY plane.

The annotation plane can be repositioned by clicking the annotation plane icon in the left toolbar. Iteratively moving the annotation plane and placing vertices is an efficient way to annotate complex 3D shapes.

#### Visualizer Controls
The 3D annotation toolbar on the left side of the screen contains all options for spatially manipulating 3D cuboids and polylines. The icons represent the following actions:
* Cancel the annotation of the current label, presenting the option to either save or discard changes

* Begin annotation of a new cuboid

* Begin annotation of a new polyline or segment

* Add a new vertex to the selected polyline

* Enable a mode where double clicking automatically closes the polyline

* Enable visualization and manipulation of the annotation plane

The camera position can be manipulated to snap to the X,Y,Z directions or to the annotation plane with the keyboard shortcuts. The number keys 1-4 and CTRL+1-4 correspond to the top/bottom, right/left, front/back, and annotation plane respectively as shown in the video below.

### How to: 3D Cuboid Annotation
To begin creating and editing 3D cuboids, enter polyline annotation mode by clicking on the cuboid icon in the annotate actions toolbar. When in cuboid annotation mode, the 3D cuboid toolbar becomes available on the left side of the Annotation Canvas.

#### Creating 3D Cuboids
After entering cuboid annotation mode, create a new 3D cuboid by clicking on the cuboid icon in the cuboid toolbar on the left side, then click the 3D scene to place the first corner of the cuboid. Click a second time to define the opposite corner of the base (XY plane) of the cuboid. This second click finishes the creation of the cuboid, always defaulting to a height of 1.0 in the lz direction.

Newly created cuboids are oriented based on the current annotation plane. The depth of the first two clicks in the 3D scene is dictated by the location of the annotation plane which is described above (defaulting to the XY plane).
#### Transforming 3D Cuboids
After selecting a cuboid, the left toolbar provides new actions to transform the cuboid via translation, rotation, and scaling.
**Translation**

Click the translation icon in the left toolbar to enable translation mode. In this mode, the cuboid can be translated (moved) along the x, y, or z axes by clicking and dragging the corresponding directional arrow on the cuboid. Additionally, you can move the cuboid within a plane (XY, XZ, or YZ) by clicking and dragging the corresponding colored plane handle. For 3D translation in all directions, click and drag the white cube at the center of the cuboid.
**Rotation**

After selecting a cuboid, click the rotation icon in the left toolbar to enable rotation mode. In this mode, the cuboid can be rotated about the x, y, or z axes by clicking and dragging the corresponding colored circle on the cuboid. You can also rotate about the plane orthogonal to the current camera view using the outermost yellow circle.
**Scaling**

After selecting a cuboid, click the scaling icon in the left toolbar to enable scaling mode. In this mode, the cuboid can be scaled (resized) along the x, y, or z axes by clicking and dragging the corresponding directional arrow on the cuboid. In addition to scaling along an axis, you can scale the cuboid within a plane (XY, XZ, or YZ) by clicking and dragging the corresponding colored plane handle.
#### Attribute Editing

Cuboid attributes can be edited in the right sidebar when a given cuboid is selected. Custom attributes in this panel are defined by the [Schema Manager](#schema-manager).
### How to: 3D Polyline Annotation

To begin creating and editing 3D polylines, enter polyline annotation mode by clicking on the polyline icon in the annotate actions toolbar. When in polyline annotation mode, the 3D polyline toolbar becomes available on the left side of the Annotation Canvas.

#### Creating Polylines
After entering polyline annotation mode, create a new 3D polyline by clicking on the polyline icon in the polyline toolbar on the left side, then click the 3D scene to create the first vertex of the polyline. After placing the final vertex of your polyline, double click anywhere on the 3D scene to finish creation of the polyline segment.

Newly created vertices are placed at the location of the mouse pointer. The depth of a newly created vertex in the 3D scene is dictated by the location of the annotation plane which is described below (defaulting to the XY plane).
#### Polylines vs Segments
The points of a single [Polyline in FiftyOne](using_datasets.md#d-polylines) are represented as a list of lists of vertices:
```python
# A list of lists of `[x, y, z]` points in scene coordinates describing
# the vertices of each shape in the polyline
points3d = [[[-5, -99, -2], [-8, 99, -2]], [[4, -99, -2], [1, 99, -2]]]
```
This allows for the possibility of multiple disjointed segments within a single polyline as shown in the code example above. This may be useful, for example, if you are annotating a dashed lane marking where each dash is a disjointed segment of the same polyline, allowing all of the segments to share the same attributes.

In the right Annotate sidebar, you can see the number of segments and vertices in the current Polyline.
#### Adding New Segments

To add a new segment to an existing polyline, first select the polyline to be edited, then select the new polyline segment button in the left toolbar and finally click to annotate the new segment.
#### Vertex Manipulation
When positioning a vertex in 3D space, the vertex controls become available when you click to select a given vertex (or the polyline centroid). These controls allow you to click either the 3 RGB directional arrows to move the vertex along the given axis, 3 CMY planes to move the vertex in the given plane, and a clickable center to position the vertex in 3D space.

#### Adding and Deleting Vertices

Vertices can also be added to and deleted from existing polylines. To add a new vertex, first select the polyline to which the vertex should be added, then click on the new vertex icon in the left toolbar, and finally select the location on the polyline that the new vertex should be added. The new vertex can now be moved to the desired location.
A selected vertex can be deleted by pressing the trash can icon in the left toolbar (or by pressing the delete key).

#### Attribute Editing

Polyline attributes can be edited in the right sidebar when a given polyline is selected. Custom attributes in this panel are defined by the [Schema Manager](#schema-manager).
In addition to custom attributes, the attribute sidebar for 3D polylines also shows the number of segments and vertices in the selected polyline, as well as the polyline-specific “closed” and “filled” attributes which affect how the polyline is rendered. Setting the “closed” attribute to True will automatically render a line segment from the first vertex of a polyline to the last vertex to close the shape. Setting the “filled” attribute to True will show the region enclosed by the polyline as filled.

Additionally, you can select the icon to the left to enter a mode that will automatically close the polyline when the annotation canvas is double clicked.

---
## How to: Editing Primitives
### Editing in the Right Sidebar
Clicking on a primitive field in the “Annotate” tab will open the editing panel in the right sidebar. Like editing a label’s attributes, you can edit the primitive’s values per the Annotation Schema.

---
## How to: AI assisted annotation 🚀 \_\_SUB_NEW_\_
FiftyOne can put models to work in the annotation editor so you spend less time
labeling by hand. Prompt masks with a segmentation model, track objects across
video frames, or auto-label a whole dataset from a few examples with Agentic
Labeling. These features run on your own GPU infrastructure as
[services](../enterprise/plugins.md#enterprise-services) started by an administrator.
### Image segmentation
Instead of drawing a mask by hand, you can prompt one with a segmentation
model. Select the AI assistance tool in the mask toolbar, then click positive
points on the object and negative points on regions to exclude; the model
returns a mask after each click, so you can add points to refine it before
saving. A built-in model works out of the box, and FiftyOne Enterprise
deployments can run larger, finetuned models as a
[service](../enterprise/plugins.md#enterprise-services) on their own GPUs.
See [Creating a Segmentation label](#creating-a-segmentation-label) for
the mask toolbar and drawing basics.
### Video object tracking
On video, prompt an object’s mask on one frame and track it across the
remaining frames automatically. Review the tracked masks and add prompts on
any frame to correct them. Video tracking is a FiftyOne Enterprise feature
powered by a segmentation model running as a
[service](../enterprise/plugins.md#enterprise-services).
See [How to: Video Annotation](#how-to-video-annotation) for the video
annotation basics.
### Agentic Labeling
Agentic Labeling uses a prompt-driven vision-language model to label an image
dataset from a few examples: describe what you want, optionally add positive
and negative example samples, preview the results, then apply the agent across
your dataset for review. It runs as a FiftyOne Enterprise
[service](../enterprise/plugins.md#enterprise-services) that an administrator starts.
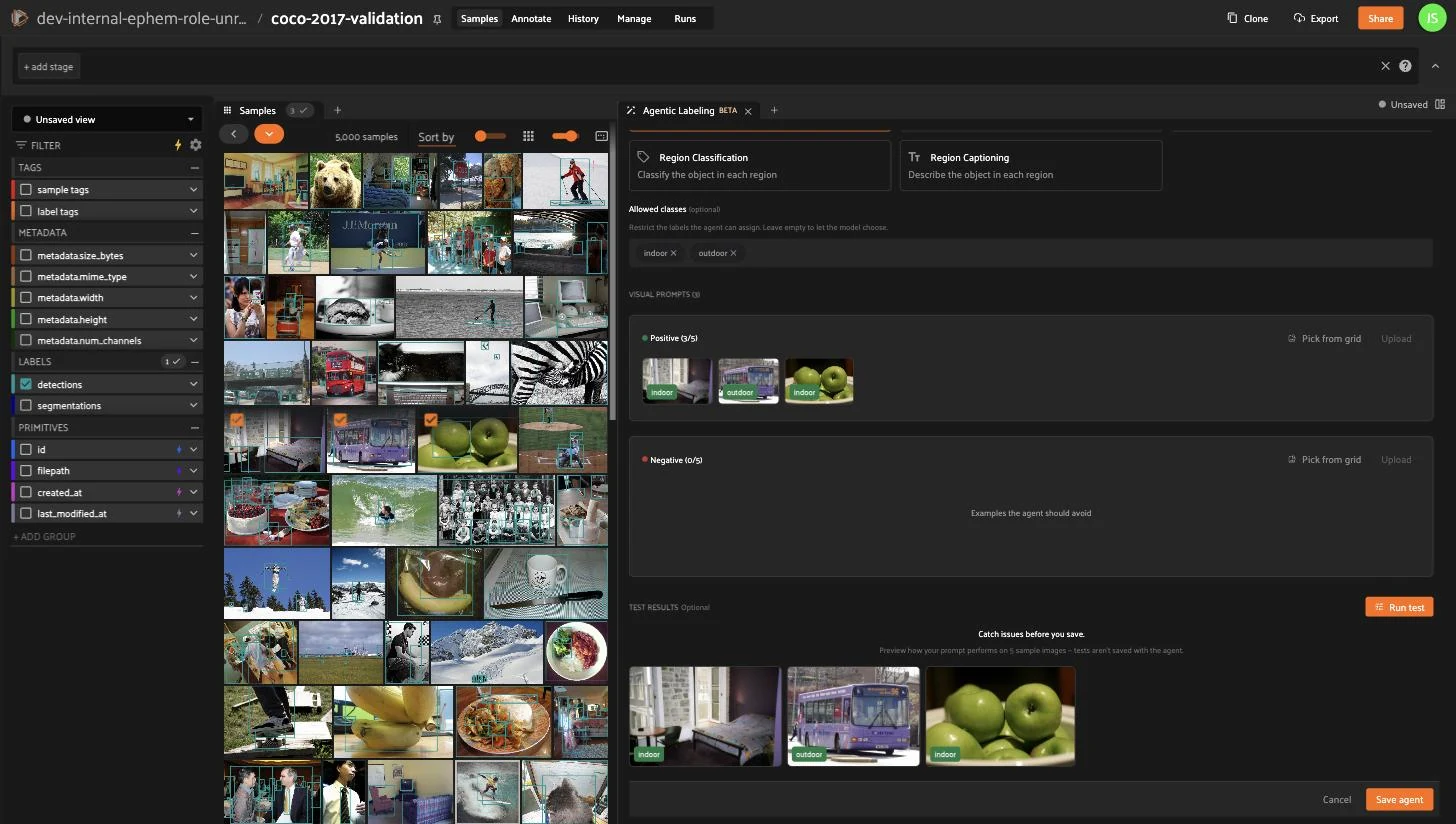
See the [Agentic Labeling](../enterprise/agentic_labeling.md#agentic-labeling) guide for the full
workflow, supported tasks, and prompting tips.