# Loading and Exploring Datasets
This notebook is a modification of the original Getting Started Notebook for the **Visual Anomaly and Novelty Detection (VAND) 2025 Challenge** at CVPR!
This challenge, sponsored by **Voxel51**, **Anomalib**, and **MVTec**, focuses on advancing **Visual Anomaly Detection** in real-world industrial scenarios. Here you’ll work with the newly released **MVTec AD 2** dataset, featuring challenging real-world conditions, distribution shifts, and unexpected defect types.
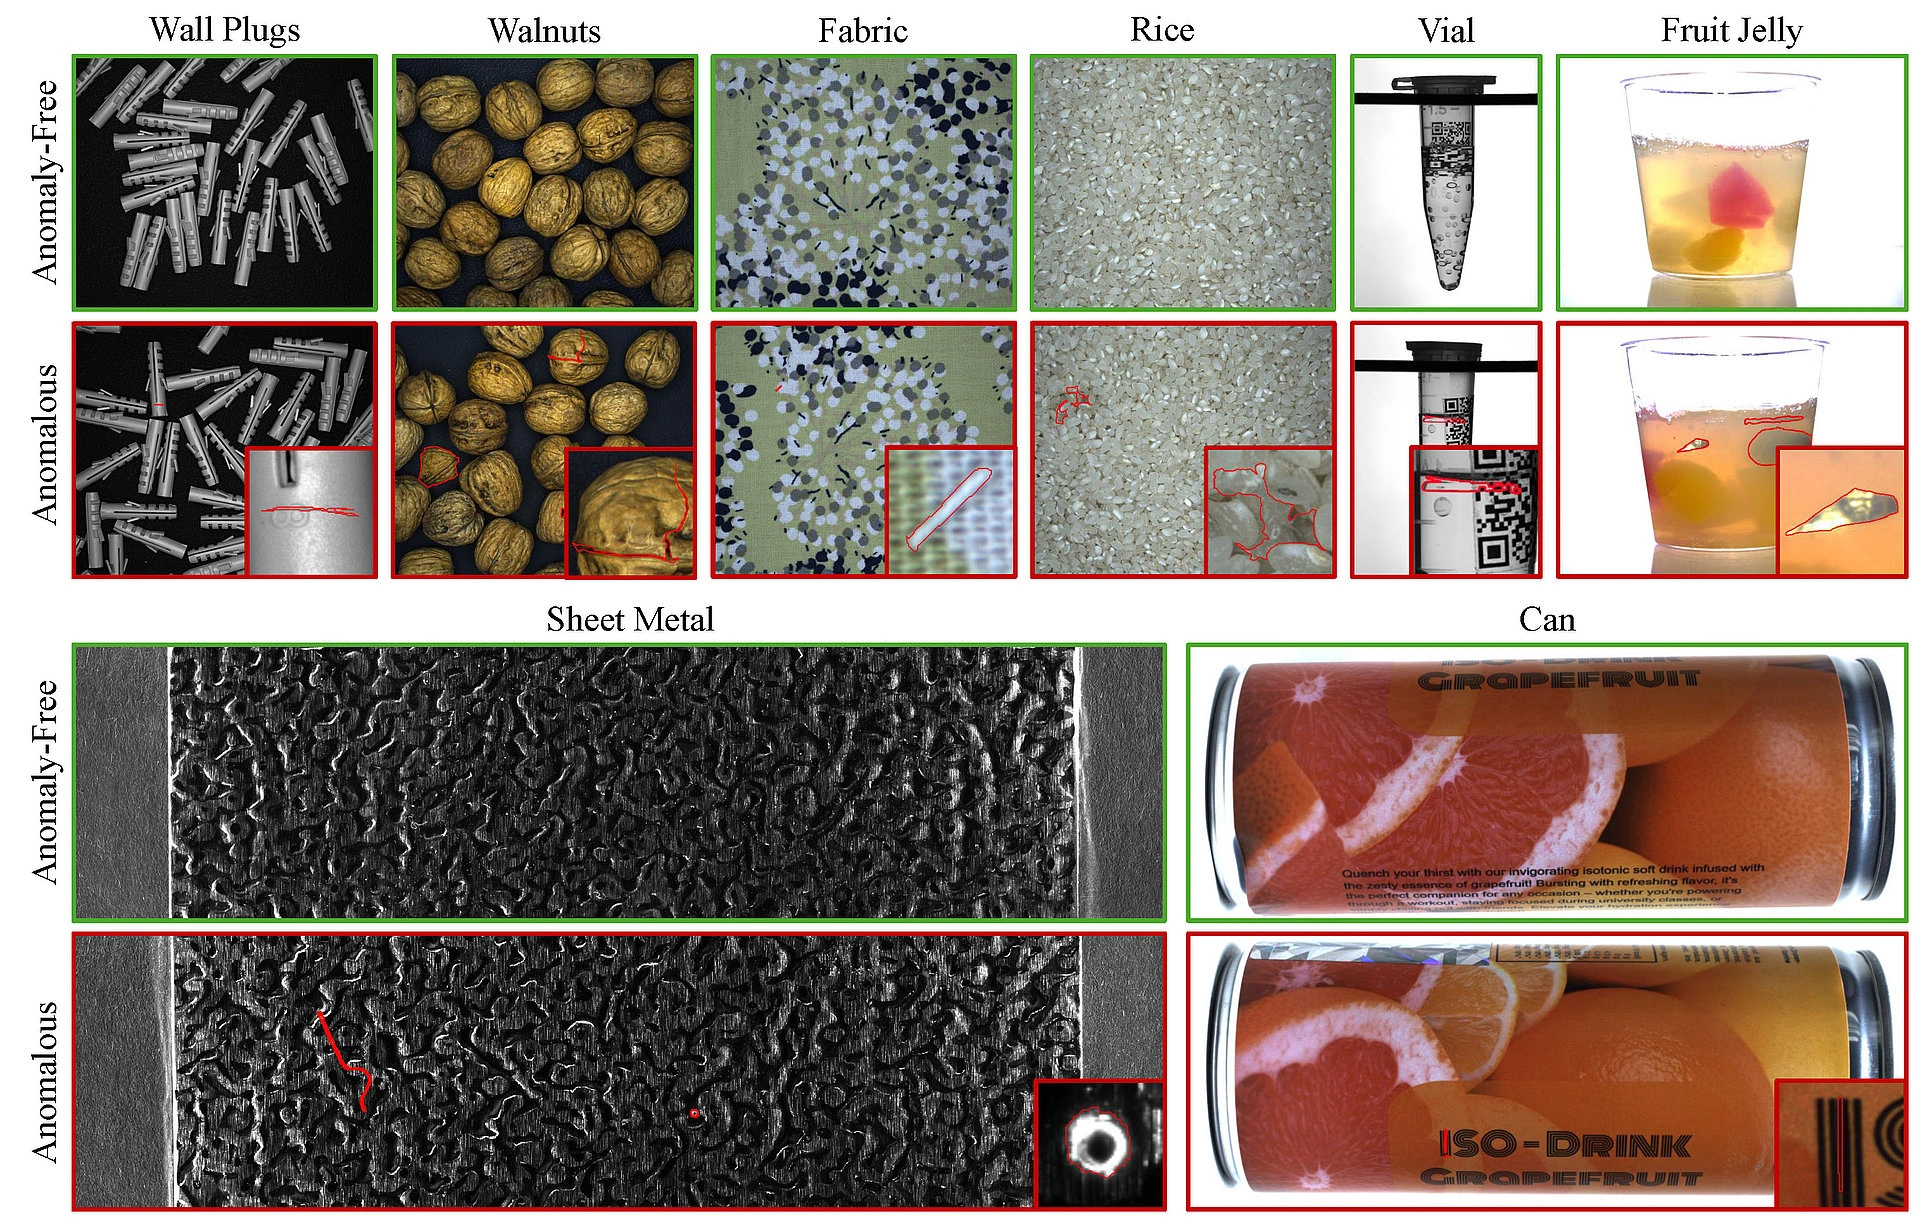
**Track 1 Dataset (MVTec AD 2)**: [Explore here](https://www.mvtec.com/company/research/datasets/mvtec-ad-2)
**Challenge Registration & Info**: [Join the challenge](https://voxel51.com/computer-vision-events/vand-3-0-challenge-at-cvpr-2025/)
**Join the Community**: [FiftyOne Discord](https://discord.com/invite/fiftyone-community) → `#cvpr-challenge-vand3-0`
**Related Documentation**
- Anomalib: [GitHub Repo](https://github.com/open-edge-platform/anomalib)
- MVTec AD2: [Download Link](https://www.mvtec.com/company/research/datasets/mvtec-ad-2)
- FiftyOne: [https://docs.voxel51.com/](https://docs.voxel51.com/)
Let’s dive into anomaly detection with top-tier tools and datasets!
## Load MVTec AD 2 Using Anomalib
This section performs an essential step in preparing or visualizing the dataset.
Note: You will need to use the Anomalib library for this notebook.
## Dataset Loading and Preprocessing Functions
This block defines several utility functions and logic to structure and load the **MVTec AD 2** dataset into a FiftyOne dataset, enriching it with custom fields like defect category, shift type, and segmentation masks.
**Key Components:**
- `explore_dataset_structure`: Recursively walks through the dataset directory and prints its structure as a DataFrame.
- `extract_shifting_info`: Determines the type of distribution shift (e.g., overexposed, underexposed) from the image filename.
- `load_segmentation_mask`: Loads a mask image as a NumPy array in grayscale.
- `find_segmentation_mask`: Finds the path to the ground truth segmentation mask corresponding to a bad image.
- `get_fiftyone_dataset`: Creates a new FiftyOne dataset named `"mvtecad2"` and populates it with:
- Image samples and their metadata
- Classification labels for category and defect
- Folder type and shift type information
- Segmentation masks for defective samples if available
The resulting dataset can be explored using FiftyOne’s App for deeper analysis and visualization of anomalies and their spatial locations.
## Load and Explore the MVTec AD 2 Dataset
This section defines the path to the **MVTec AD 2** dataset, explores its structure, and loads it into a FiftyOne dataset using the previously defined helper functions.
**What it does:**
- Sets the base path to the dataset (update the path if needed).
- Calls `explore_dataset_structure()` to print a high-level view of the folder hierarchy and file counts.
- Uses `get_fiftyone_dataset()` to construct and populate a FiftyOne dataset with images, metadata, labels, and segmentation masks.
- Reloads and prints summary information about the loaded dataset to confirm successful ingestion.
## Launching FiftyOne App
Launch the FiftyOne App to explore the dataset in an interactive interface.
## Explore image quality in MVTec AD 2
Install `image-quality-issues` plugin in your FiftyOne Environment
## Check dataset schema
## Creating a Grouped Dataset with Segmentation Masks
This section defines a function to create a **grouped dataset** in FiftyOne, where each sample has two views:
- The **original image**
- Its corresponding **segmentation mask**
**What’s included:**
- Imports essential libraries: `os`, `numpy`, `OpenCV (cv2)`, and `FiftyOne`.
- `create_grouped_dataset()`:
- Deletes an existing grouped dataset (if it exists).
- Loads the original dataset and iterates through samples.
- Copies metadata fields such as category, defect type, and shift type.
- Saves segmentation masks (real or blank) to a `masks/` subfolder next to each image.
- Uses FiftyOne’s native grouping feature to associate each image with its mask under a shared `Group`.
This setup is especially useful for workflows involving **paired data**—like image and segmentation mask combinations, enabling visual comparison and structured exploration within the FiftyOne App. Ideal for exploring tasks with the MVTec AD 2.
## Generate and Load the Grouped Dataset
In this step, we create and load a grouped version of the MVTec AD 2 dataset using the `create_grouped_dataset()` function defined earlier.
**What it does:**
- Calls the function with the original dataset name (`"mvtecad2"`) and the desired grouped dataset name (`"mvtecad2_grouped"`).
- Reloads the dataset to ensure it’s updated in memory.
- Prints the dataset summary to confirm successful creation.
This grouped dataset allows us to explore each image alongside its corresponding segmentation mask using FiftyOne’s powerful group-based visualization.
## Dynamic Grouping of Samples by Category
This section demonstrates how to dynamically group a subset of the dataset based on ground truth labels using FiftyOne.
**What it does:**
- Randomly selects 100 samples from the dataset using a fixed seed for reproducibility.
- Groups the selected samples by the `category_label.label` field (e.g., bottle, cable, etc.).
- Prints the media type of the resulting grouped view and the number of groups.
- Updates the FiftyOne App session to display this grouped view, making it easier to explore anomalies by category.
Grouping by labels enables intuitive visual inspection and comparative analysis across different object categories.
## Compute Visual Embeddings with CLIP and UMAP
In this step, we leverage FiftyOne Brain and a pre-trained CLIP model to compute a visual embedding space for the dataset.
**What it does:**
- Imports the `fiftyone.brain` module for computing embeddings and visual insights.
- Loads a pre-trained CLIP model (`ViT-B/32`) from the FiftyOne Model Zoo.
- Computes visual embeddings for the dataset using CLIP and projects them into 2D using **UMAP**.
- Stores the results under the brain key `"clip_vis"` and embedding field `"clip_embeddings"`.
This enables powerful visual exploration and clustering of semantically similar images in the FiftyOne App using the Brain panel.
## Exporting the Dataset in FiftyOne Format
This section exports the annotated dataset to disk in the native **FiftyOneDataset** format.
**What it does:**
- Defines a target export directory named `"MVTec_AD2_FO"`.
- Uses `dataset.export()` to write all samples, labels, and metadata to that directory.
This export can be reused later to reload the dataset easily or to share it with collaborators in a structured format supported by FiftyOne.
 Run in Google Colab
 View source on GitHub
 Download notebook